Instagram Stats You Need to Know in 2023
Learn which stats are essential for tracking as a brand on Instagram as well as some current stats you need to know about the platform.
With so many competing social media apps, you might be wondering — is Instagram still worth using in 2023?
That answer is a resounding yes, and we have the stats to back that up.
Instagram is the fifth most visited website in the world, behind only Google, YouTube, Facebook, and Twitter.
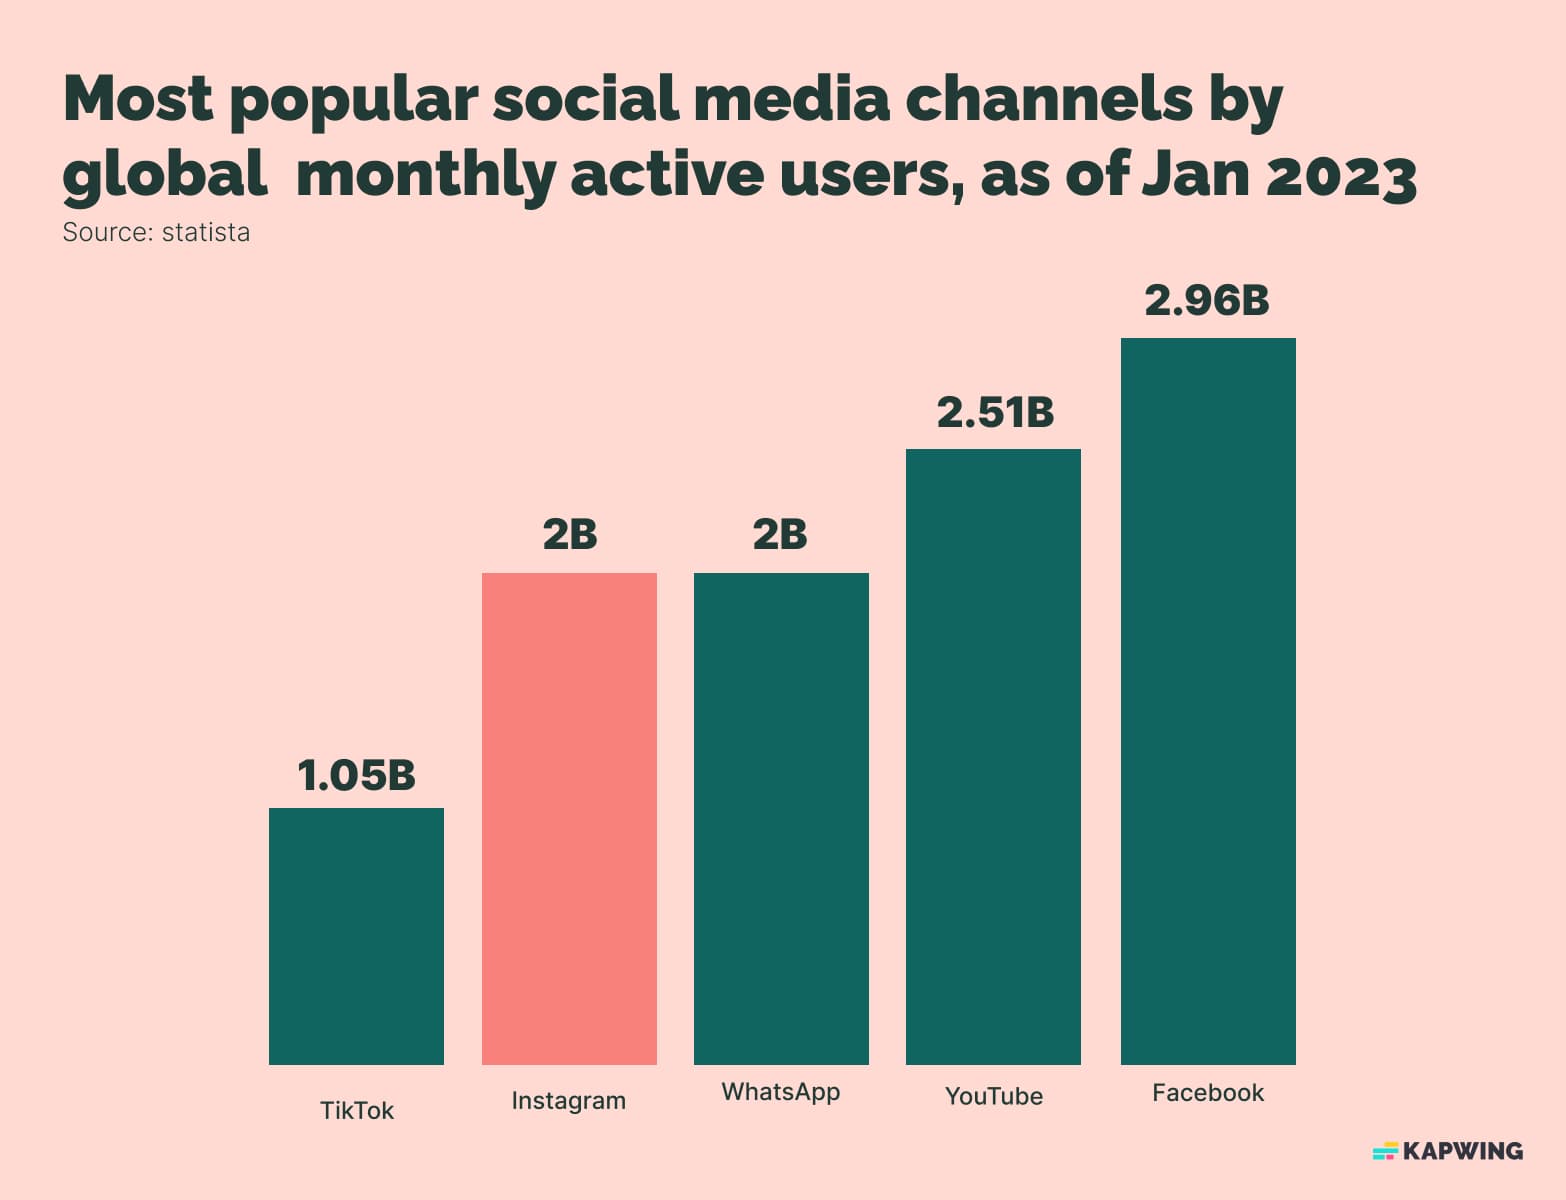
Instagram also boasts 2 billion monthly active users as of January 2023, making it the fourth most visited social media platform, ahead of even TikTok.
That’s a lot of Instagram users, and a lot of potential eyeballs for your content. In fact, Instagram is the second-most popular platform for social media marketers, with only Facebook out ahead.
Instagram also remains one of the top social media platforms for engagement, which is the top stat brands should be looking at. On Instagram, static photo posts have an average engagement rate of 1.74% and for video posts it’s 1.45%, according to Search Engine Journal. Carousel posts are the highest, at 1.92%.
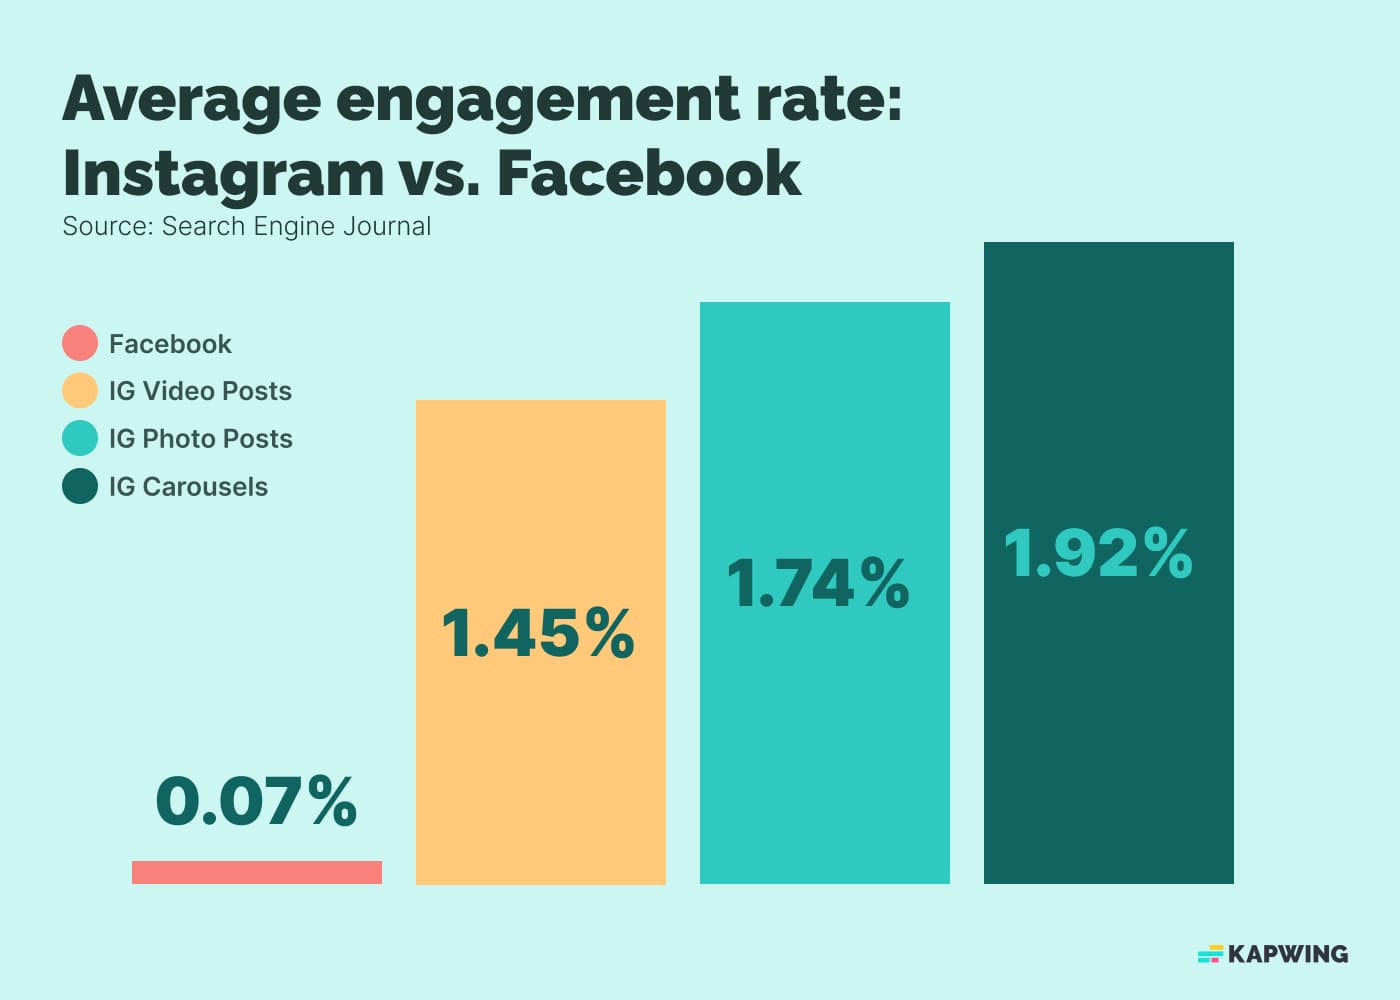
By comparison, the average engagement rate for Facebook users is just 0.07%.
Added all up, that means whether you’re a small business or a large brand, Instagram remains a powerful platform for engagement and it should absolutely be a key part of your social media marketing strategy.
Of course, tracking your own analytics on Instagram is an important part of that process. Here, we’ll go over what vital Instagram statistics of your own you should be following, how those tie into Instagram statistics about the app itself, and methods for following everything you need to know.
The most important Instagram stats to track for success
Let’s go over the Instagram stats you should be tracking from your own account and why they’re important.
Follower growth rate
On Instagram, your follow growth tracks how many new followers you’ve gained or lost over time — though hopefully it’s a net gain!
This is an indication that your posts are reaching your target audience and capturing the attention of new fans or customers.
The average follower growth rate for a business account on Instagram is 0.98% per month, so if you’re meeting or beating that, you know you’re doing well.
If you’re below that, it’s a sign that you need to rethink your Instagram posting strategy.
Post engagement rate
This looks at how many Instagram users have liked, commented on, or shared your posts. If you take that number and divide it by either your total followers or your post’s reach, you can determine an engagement rate.
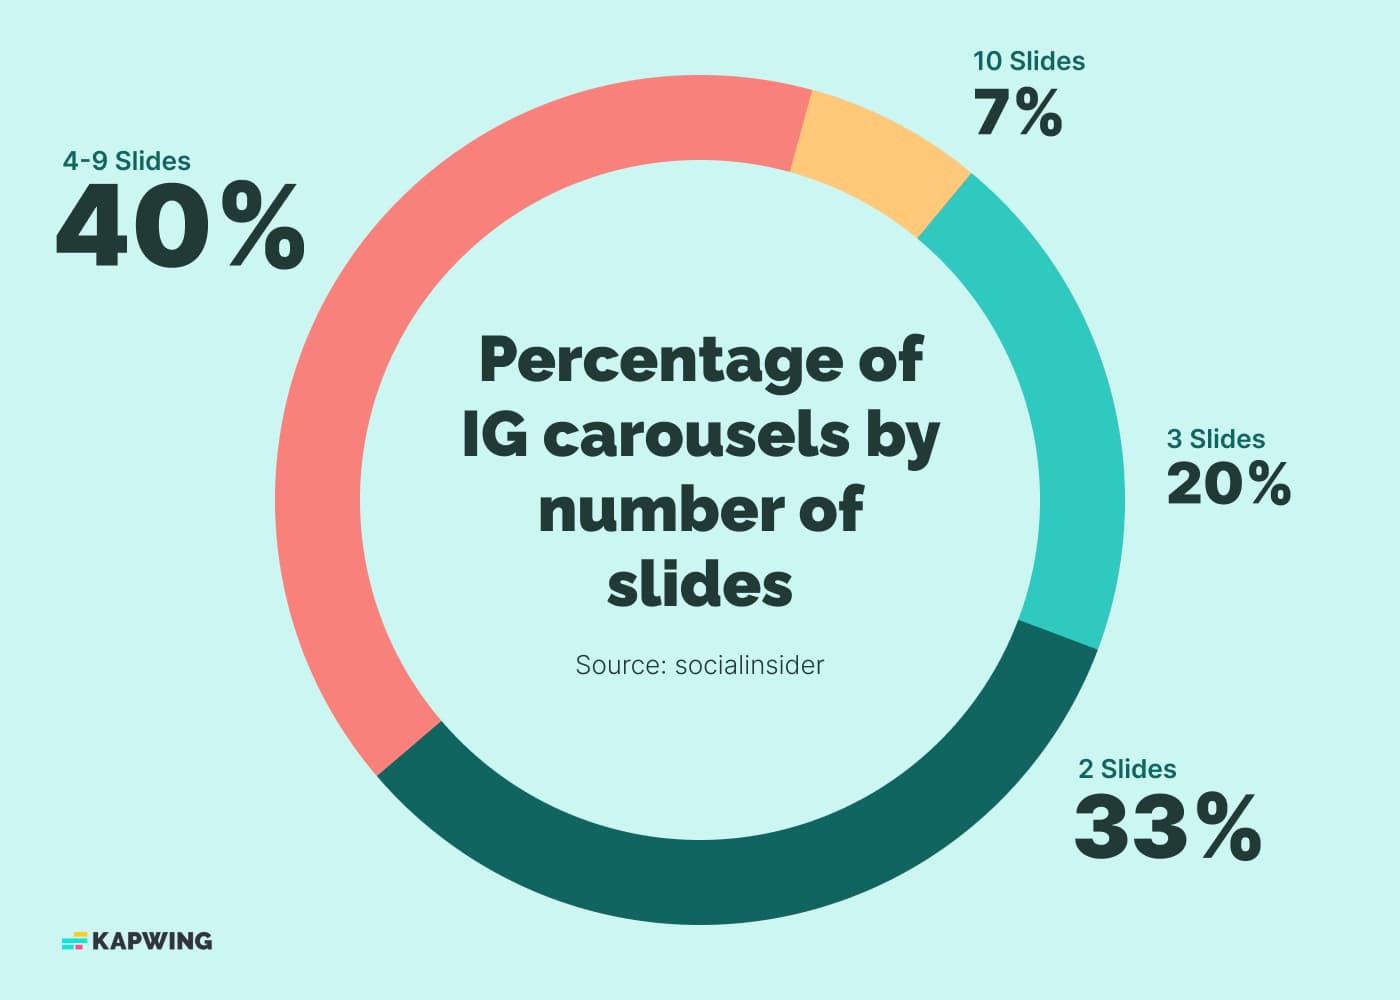
As mentioned above, average engagement rates vary but the type of post you’re making on Instagram. Carousel posts have proven to have the highest engagement rate at 1.92%. In fact, that shoots up to over 2% if you include the maximum ten slides in a carousel post.
Reels engagement rate
Again, this looks at how many Instagram users have interacted with your content, specifically your Instagram Reels — short-form, vertical video on Instagram. In 2022, the average engagement rate for Instagram Reels was 1.95%, according to Social Insider.
This engagement rate has fallen off some recently as the algorithm has started to favor carousel posts slightly, but Instagram Reels are still some of the most engaging content you can post on the app.
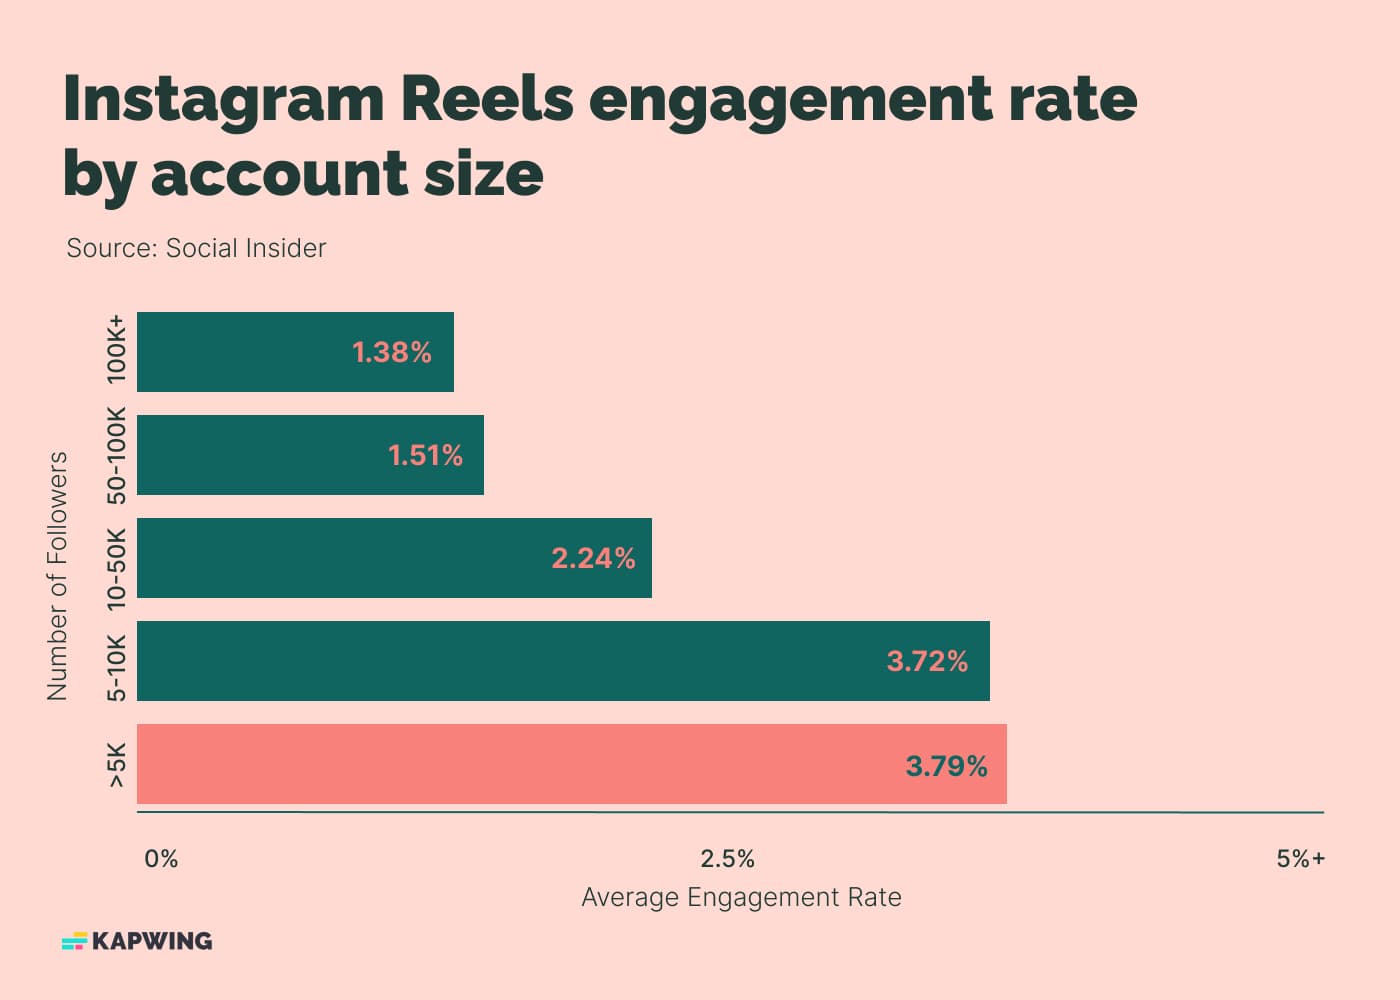
Interestingly, Social Insider also found that the size of Instagram accounts matter. Instagram accounts with 5,000 or fewer followers saw the highest Reels engagement rate at 3.79% on average.
Stories reach rate
Unlike feed posts and Reels, Instagram stories are better by reach — how many Instagram users actually viewed them.
If it seems like your reach on Instagram stories is going down, you’re not alone. According to this Rival IQ study, Instagram story reach rates declined from 2021 to 2022. Smaller accounts saw the lowest decline, but a decline nonetheless.
Post frequency
The name of the game when it comes to posting on Instagram is consistency. To build a following that remains engaged, it’s recommended to post three to five times per week. Keep track of your post frequency to ensure you’re keeping a consistent posting rhythm and compare your frequency to changes in engagement.
It takes experimentation to find the sweet spot for frequency that results in engagement, but a Later.com study found that Instagram accounts with 100,000 followers or less posted an average of three feed posts per week. For accounts between 100,000 and 500,000 Instagram followers, it was an average of five posts per week.
Best time to post
The best time to post on Instagram will vary — it depends on your unique target audience. You can use your own Instagram statistics, whether in the app itself or with a third-party tool, to determine your own best time to post.
If you’re just starting, a good rule of thumb is to post on Instagram on weekdays before noon.
Audience demographics
Your own Instagram user statistics can tell you a lot about exactly who your audience is, including their ages, gender, and location. This information can be used to better tailor your posts, your timing, and targeting for your Instagram ads.
Looking at general stats, 49.3% of people on Instagram are female users, making Instagram more skewed towards female users than many other social media platforms like Twitter and Facebook.
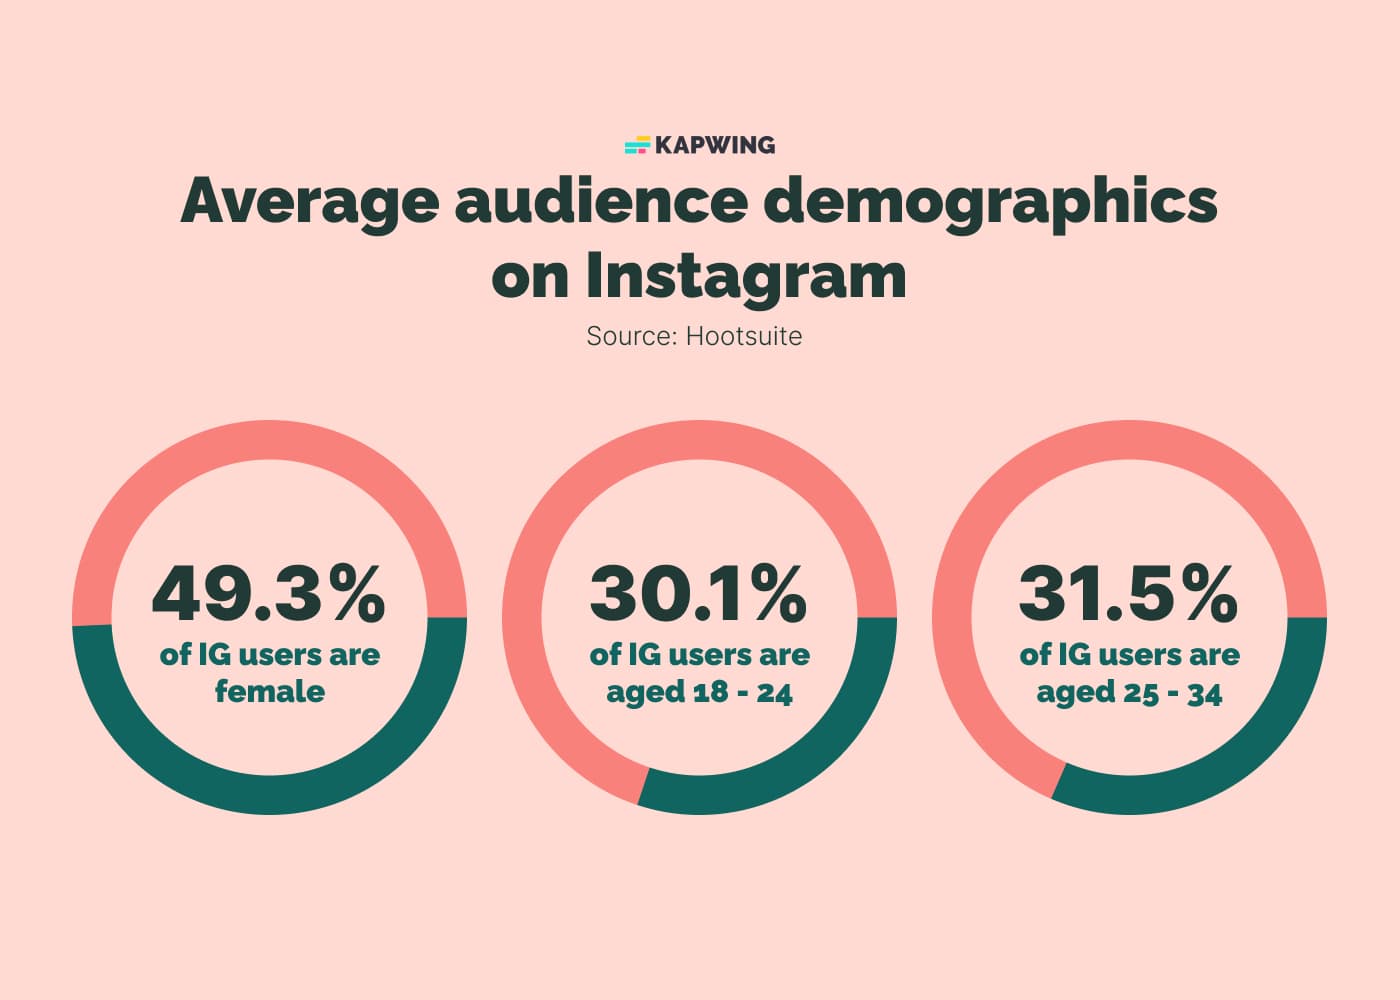
In terms of age, most Instagram users are on the young side, with 30.1% of Instagram users being aged 18 to 24 and 31.5% being aged 25 to 34.
Website clicks
If you’re a brand on Instagram, one of your goals is going to be converting followers into customers. To do that, you want them to click on the link in your Instagram bio, or links in your Instagram stories.
Hootsuite did an experiment to see if including the phrase “link in bio” in your Instagram post captions led to higher engagement — the answer is yes, although it’s subtle.
How to track your Instagram stats
There are two methods to track your personal Instagram statistics — either using the app’s native analytics tool, or by using a third-party analytics tool. Let’s take a closer look at both options.
How to track your Instagrams stats in the app
The analytics tool in the Instagram app is called Insights. You need to have a business or creator account in order to access this tool.
Once you have that, here’s how to open Insights:
- Tap your profile icon.
- Tap the three lines icon in the upper right corner.
- Tap Insights.
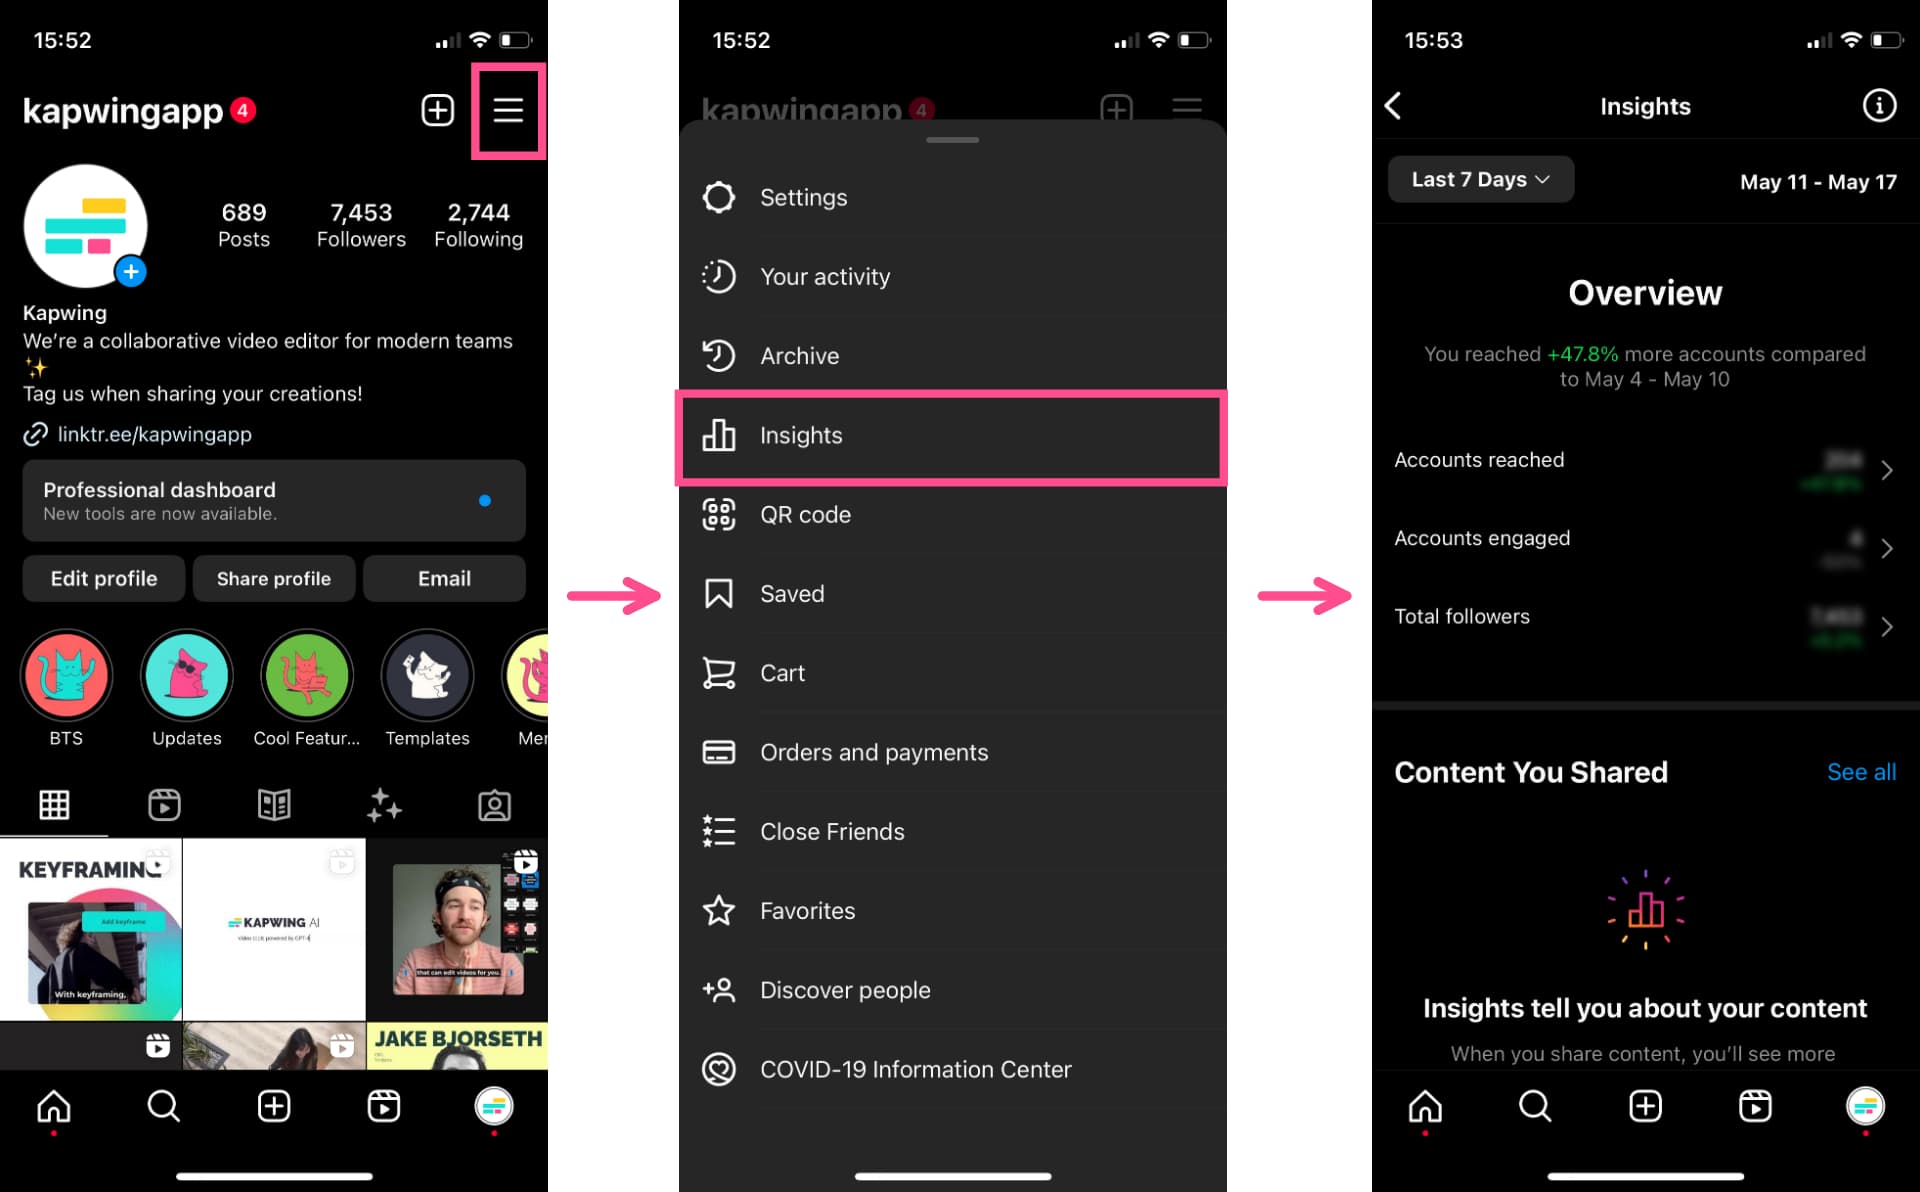
Here, you’ll find an overview of how your Instagram posts are performing, including:
- Accounts reached
- Accounts engaged
- Total followers
You’ll also find more detailed information about individual Instagram posts.
Unfortunately, Insights only offers stats from the last 90 days of your account activity. The data also can’t be exported.
The other way to see Insights in the Instagram app is to go to your profile page and tap on an individual post. Underneath the image or video you’ll see blue text that says “View insights.”
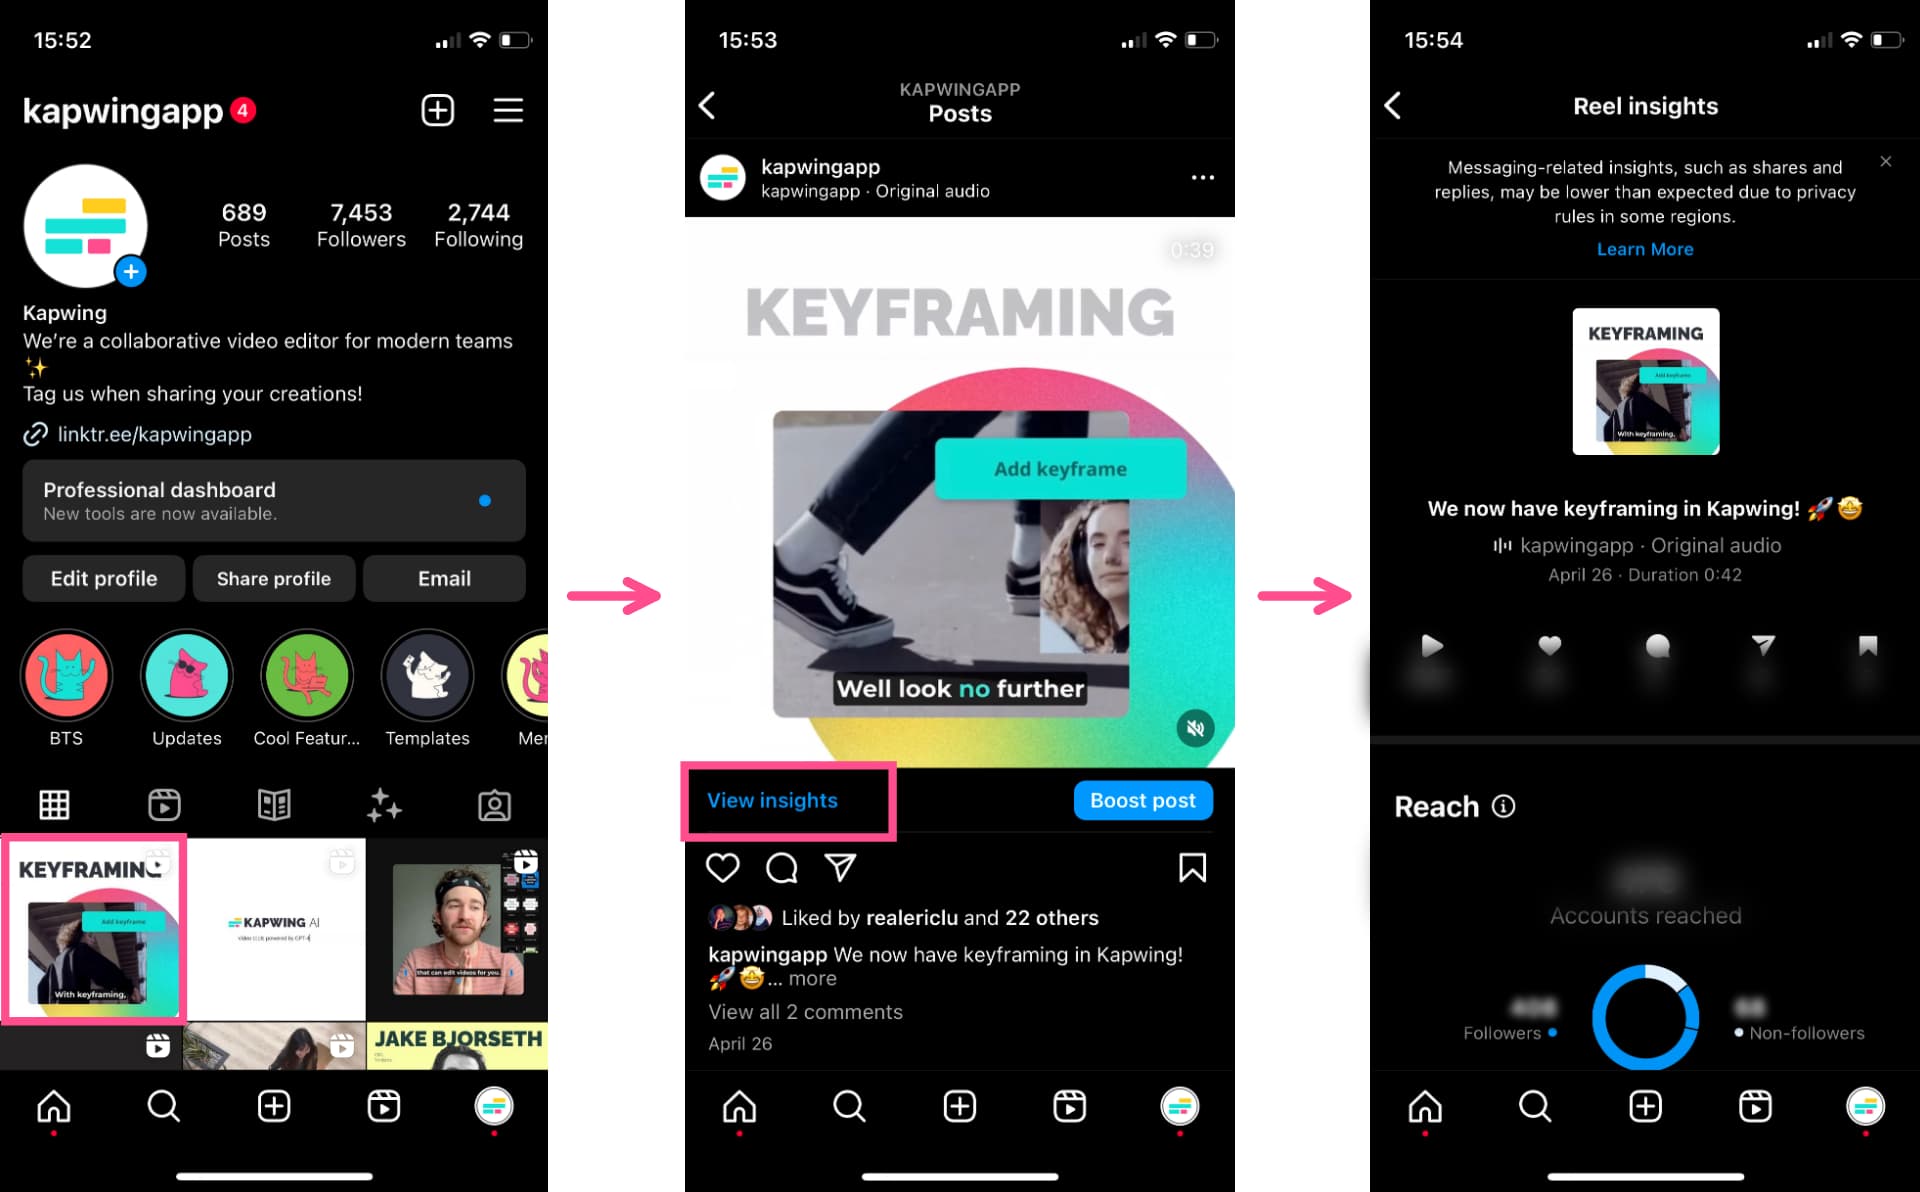
This will open a screen that shows detailed stats for that post, including:
- Number of likes, comments, shares, and bookmarks from Instagram users
- Instagram users reached
- Content interactions
- Profile activity
- Impressions
- Profile activity like profile visits, external link taps, and follows
- Audience demographics like gender, age, and location
In this screen you’ll also find performance stats if you turned that post into an Instagram ad, including:
- Profile visits from Instagram users
- Ad spent
- Cost per profile visit
How to track your Instagram stats with third-party tools
The Insights tool is a good overview of how Instagram users are interacting with your feed and video posts, but the options are pretty basic. If you’re looking for deeper analytics, the ability to export data, or an easier way to track multiple accounts, a third-party analytics tool is your answer.
The downside is that these tools do come with a price — but they’re an essential addition if you need more sophisticated metrics.
Here are some options:
Track, optimize, and make the most of your Instagram stats
Instagram is truly a must-use social media platform for any brand. But you’ll only know how well you’re performing on the app if you use analytics tools to check in on your stats.
Whether you go with the internal Insights tool or a third-party tool, use that valuable data to optimize your content and grow your followers.
Instagram Stats FAQ
1. Can you see Instagram statistics?
Yes! But you’ll need a professional or creator account. If you have that, tap the three lines icon on your profile page and then tap Insights to see analytics for your account.
2. Where can I see my Instagram usage statistics?
To open analytics in the app, you need a professional or creator account. If you have that, tap the three lines icon on your profile page and then tap Insights to see analytics for your account.
You can also use a third-party Instagram analytics tool — these have a cost but don’t require a professional or creator account to use.
3. Is Instagram worth it in 2023?
If you’re a brand or marketer, the answer is absolutely yes. Instagram is the second-most popular platform for social media marketers, with only Facebook out ahead.
4. Are less people using Instagram now?
No, Instagram’s base of active users continues to grow, meaning it’s still a viable and important social media platform.
Additional Resources:
- Instagram SEO: The Ultimate Guide to Gaining More Visibility
- 80% of People Prefer Video Subtitles. Here's How they Affect Engagement.
- How to Use Instagram Alt Text to Make Your Posts More Accessible

