41 UGC Statistics for Marketers and Creators (2026)
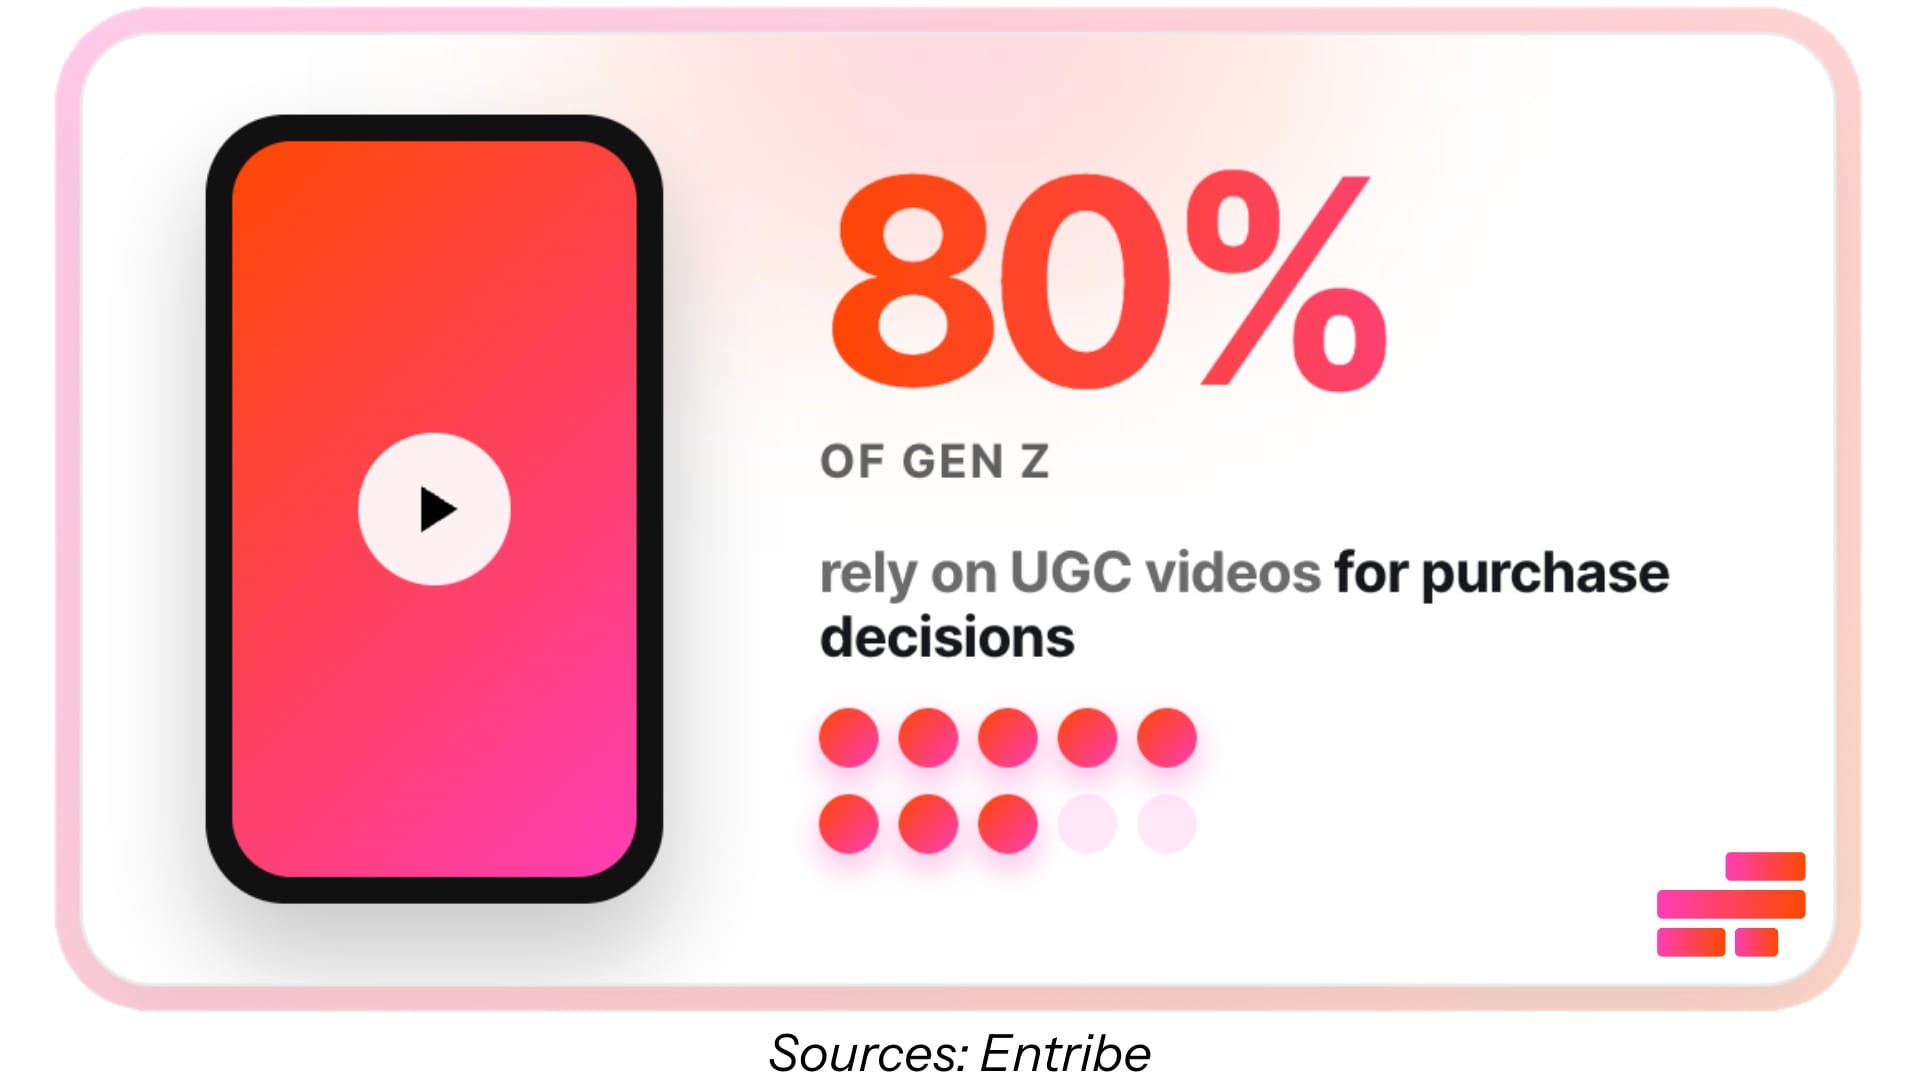
80% of Gen Z relies on UGC videos for purchase decisions.
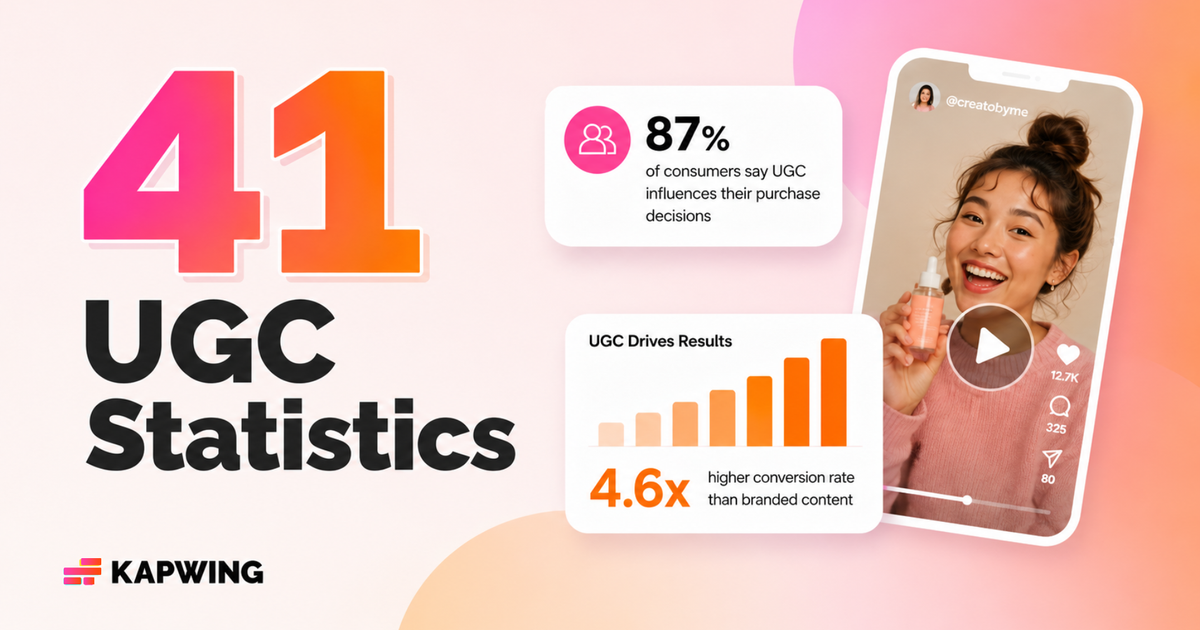
The future of marketing is UGC. Consumers trust real people far more than polished brand campaigns, and the numbers back it up: UGC can drive higher engagement, stronger conversion rates, and more purchase confidence, yet many brands still underinvest in it. As creator-led content becomes the default across TikTok, Instagram, YouTube, and ecommerce, brands that know how to use UGC effectively are pulling ahead.
In this article, we’ll break down the most important UGC statistics shaping marketing right now, from trust and conversion data to ad performance, creator trends, and the rise of AI-generated UGC.
Whether you’re building a content strategy, running paid campaigns, or exploring new creator workflows, these numbers show where UGC is working and where it’s heading next.
Table of Contents:
- What Is UGC Content?
- UGC Trust & Consumer Behavior Statistics
- UGC Conversion & Purchase Statistics
- UGC Creator Statistics
- UGC Ads Statistics
- UGC Jobs & Market Statistics
- Social Media & UGC Statistics
What Is UGC Content?
User-generated content (UGC) is any brand-related content created by real users, customers, or creators instead of the brand itself. This includes reviews, testimonials, unboxings, product demos, TikToks, photos, and social posts showing real experiences with a product or service.
A big reason UGC performs so well is that it feels more authentic than traditional advertising. People are more likely to trust content that looks candid, relatable, and experience-driven, especially when researching products before buying.
Below is an example of a UGC video, where a creator introduces a handbag and talks through their experience using it, showing how it looks, what fits inside, and how they’d actually use it day-to-day.
@anyualex watch till the end for a what’s in my bag 🐝 my review on the aest studios capture tote! a new staple for travel, work, studies, etc 🖤 #AestStudios #AestBags #FunctionalAesthetics @aeststudios_official ♬ original sound - Peaceful Melody World
UGC Trust & Consumer Behavior Statistics
Before UGC drives clicks or conversions, the UGC script firstly shapes how people feel about a brand or product. A lot of its impact comes down to trust, how believable, relatable, or honest the content seems compared to traditional marketing.
For many consumers, seeing real people use a product provides context that branded content often can’t. The stats below highlight how consumers perceive UGC and why it plays such a strong role in building trust.
- 60% of consumers consider UGC the most authentic content
- 90% say authenticity is important when choosing brands
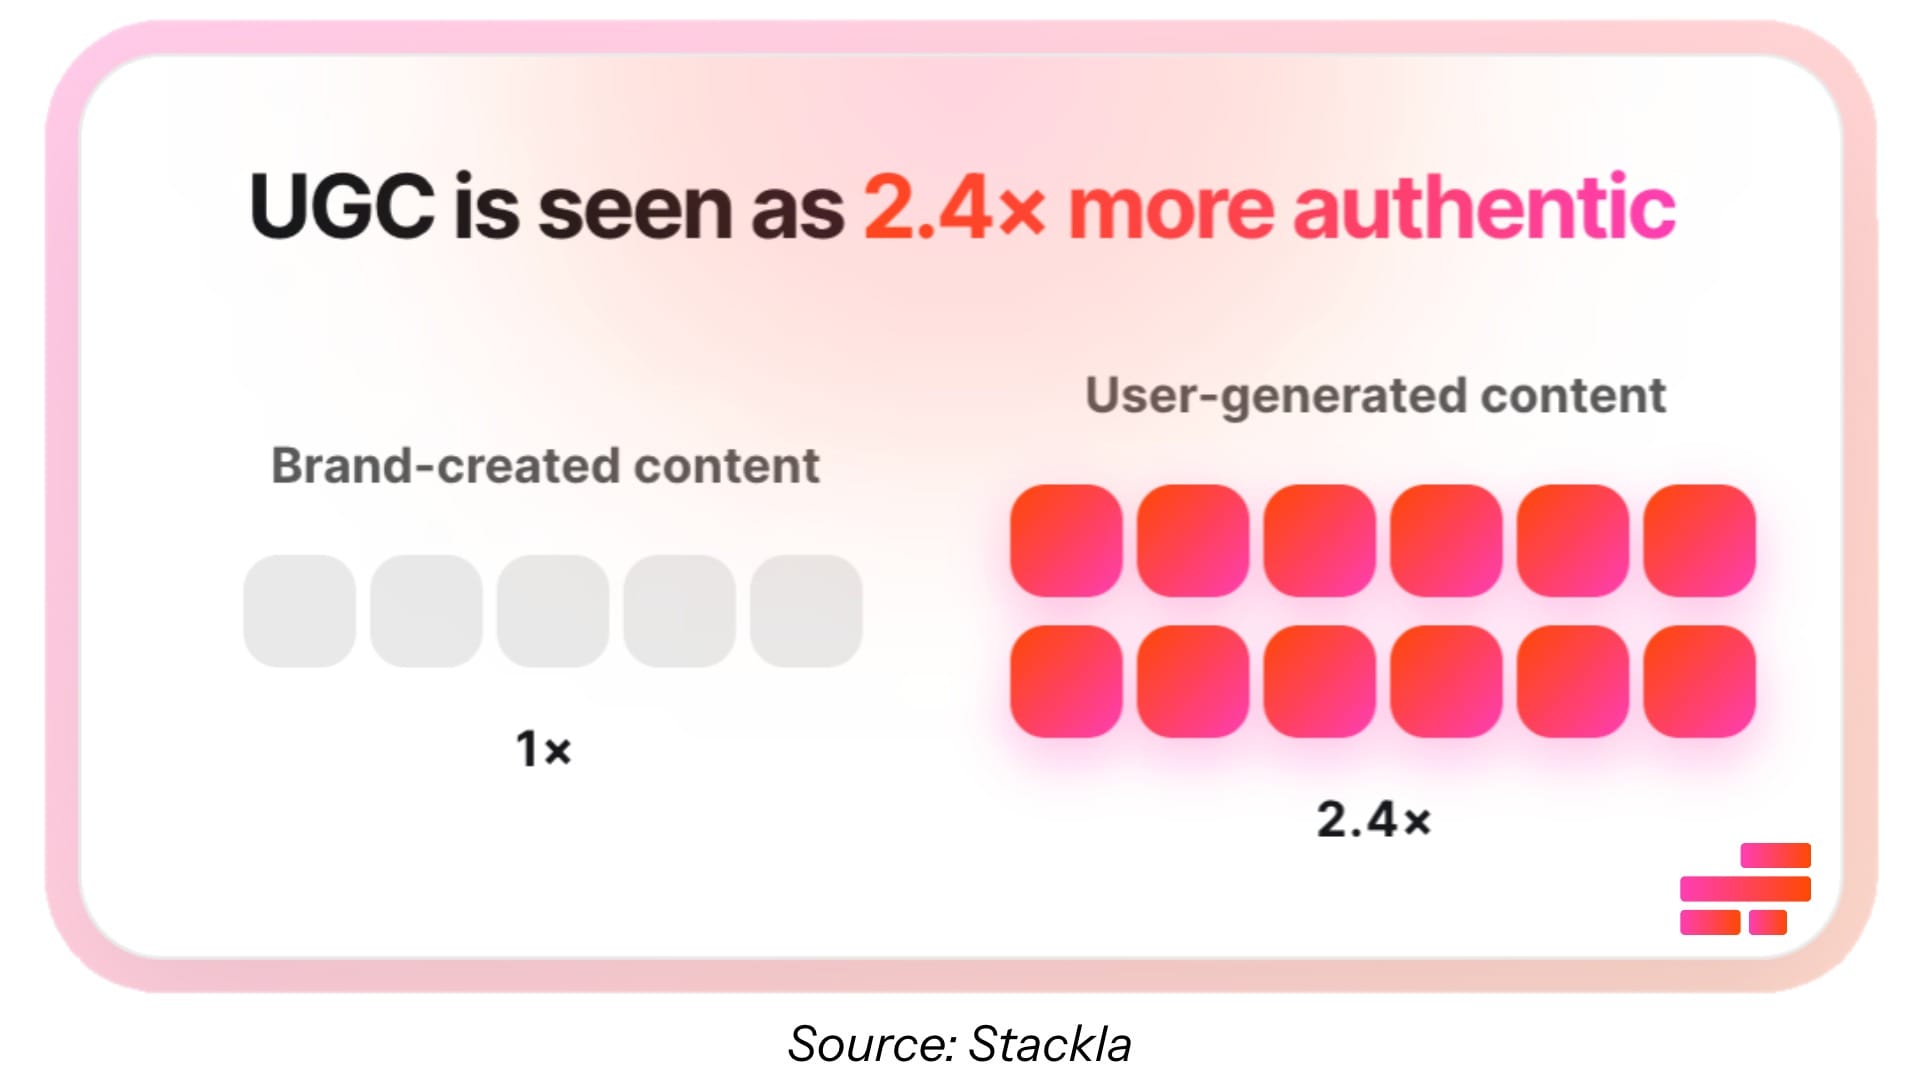
- Consumers are 2.4x more likely to view UGC as authentic than brand content
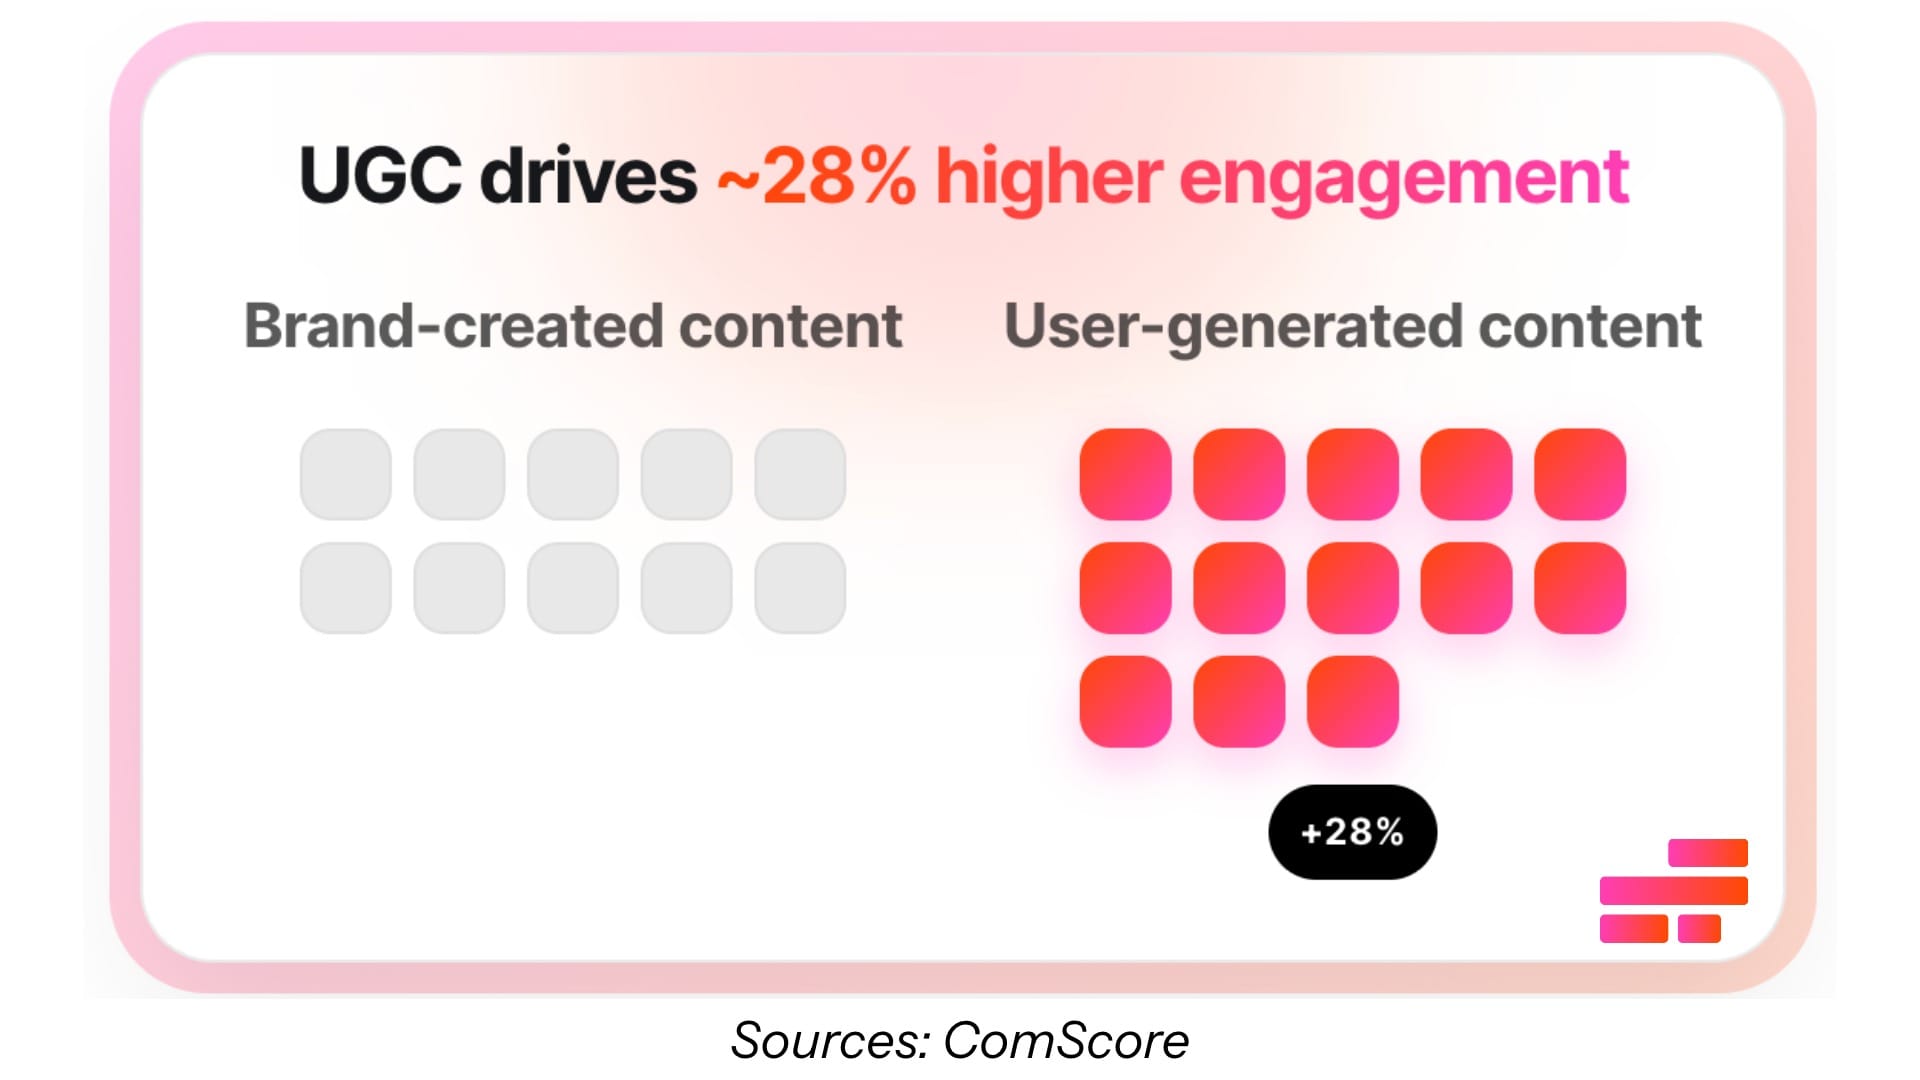
- UGC generates ~28% higher engagement than branded content
- UGC posts can drive up to 6.9x more engagement
- UGC is 35% more memorable than other media
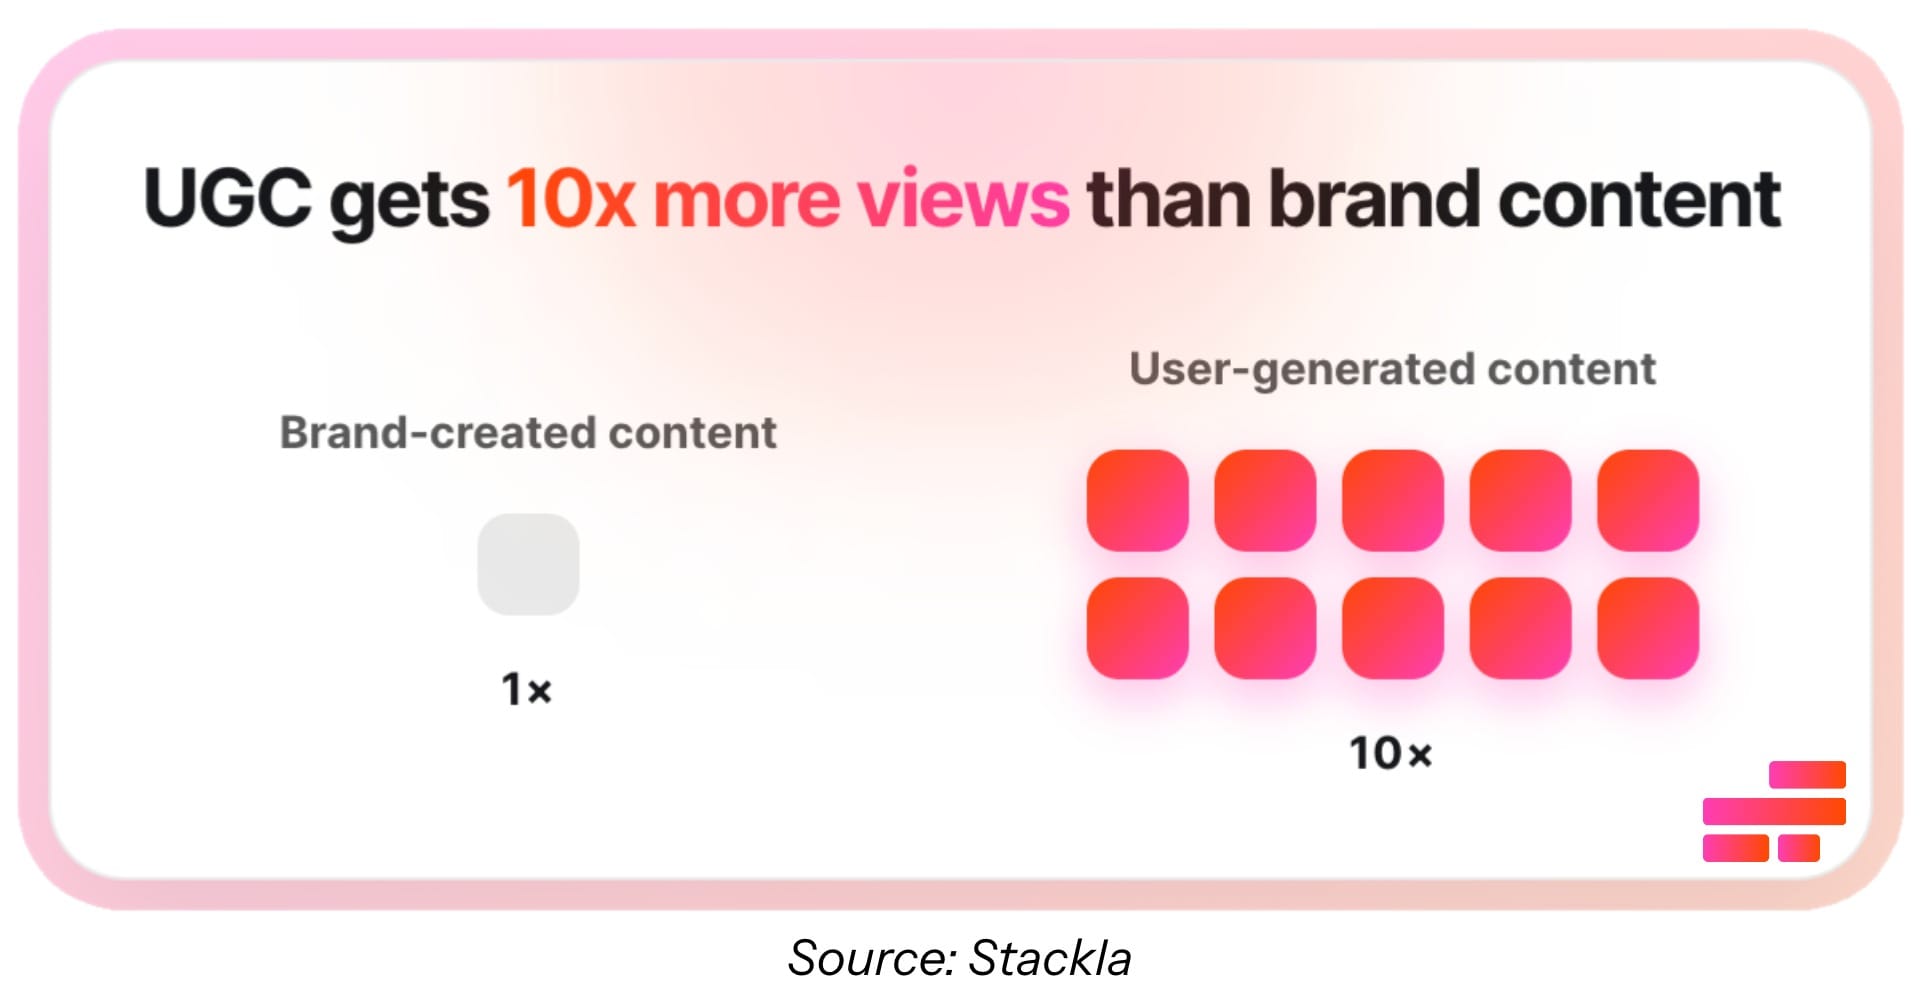
- User-generated content receives 10x more views than brand-created content
- UGC in email increases CTR by ~78%
- Social media campaigns with UGC see 50% higher engagement
- Brand engagement rises by 28% when mixing UGC with branded content
Sources: Stackla, Comscore, TINT, Adweek
UGC Conversion & Purchase Statistics
Trust is important, but what really matters for most brands is whether UGC leads to action. Across ecommerce and digital marketing, UGC is often used at key decision points, especially on product pages, landing pages, and ads.
These statistics focus on how UGC influences purchasing behavior, from increasing conversion rates to reducing drop-off.
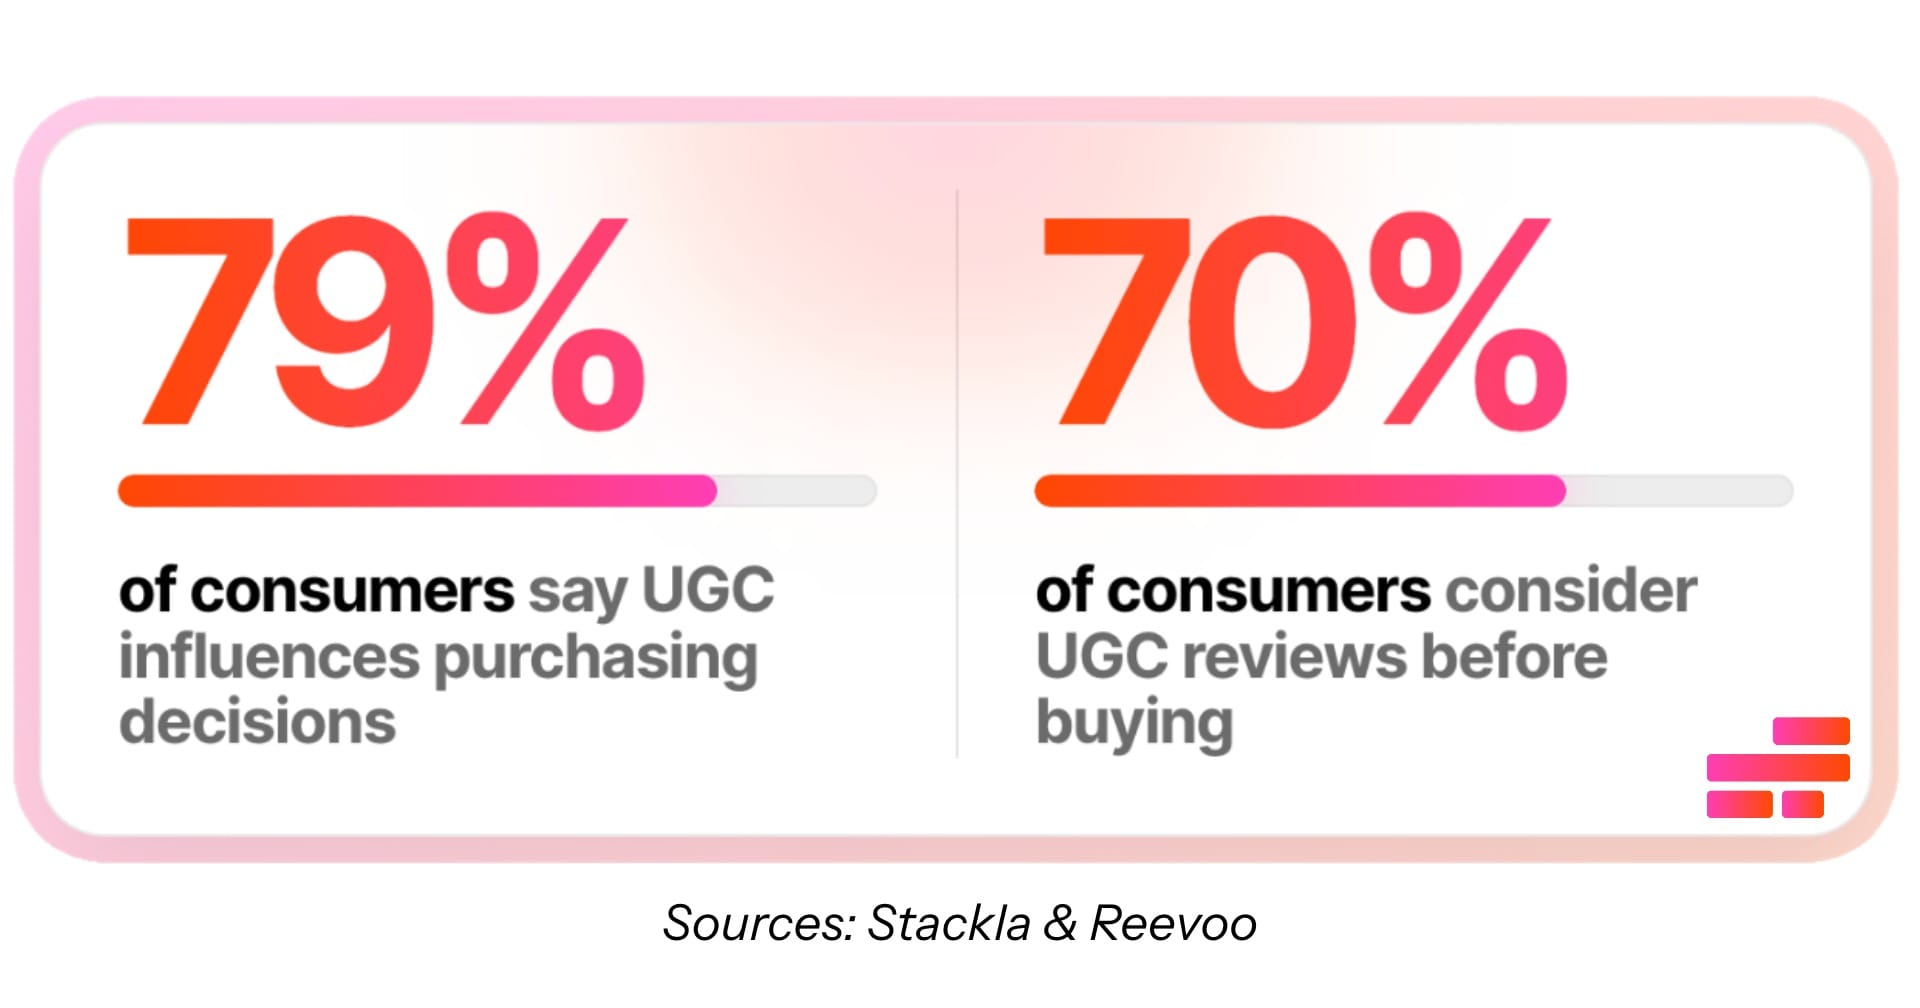
- 79% of consumers say UGC influences purchasing decisions
- 70% of consumers consider UGC reviews before making a purchase
- 82% are more likely to buy from brands using UGC
- UGC increases conversions by ~29% on average
- Conversion rates can increase by up to 161% with UGC
- Displaying reviews can boost conversions by up to 270%
- 65% of consumers have purchased apparel after seeing UGC visuals
- 58% have left a site without purchasing due to lack of UGC
- 57% say UGC is a top factor on product pages
- 89% of shoppers spend 5+ minutes consuming UGC before buying
Sources: Campaign Monitor, Ipsos, TINT, Olapic, ComScore, Reevoo
UGC Creator Statistics
UGC doesn’t exist without the people creating it. While not everyone identifies as a “creator,” a large number of consumers regularly post about products, share experiences, or contribute content that brands can reuse.
This section looks at how often people create and share UGC, how different demographics participate, and how creators are shaping the content landscape.
- 69% of adults—and 87% of Millennials—share UGC on social media
- Consumers create 2.5x more content about brands than brands create themselves
- 51% of consumers are more likely to share brand content if it features UGC
- 80% of Gen Z relies on UGC videos for purchase decisions
Sources: Entribe, Bazaarvoice, Spiegel Research Center
UGC Ads Statistics
More brands are using UGC in paid campaigns, especially on platforms like TikTok, Instagram, and YouTube. Instead of polished, highly produced ads, many are turning to content that looks more like something you’d see in your feed.
These stats focus on how UGC performs in advertising, covering metrics like click-through rates, engagement, and effectiveness compared to traditional ad formats.
- UGC-based ads get 4x higher click-through rates (CTR)
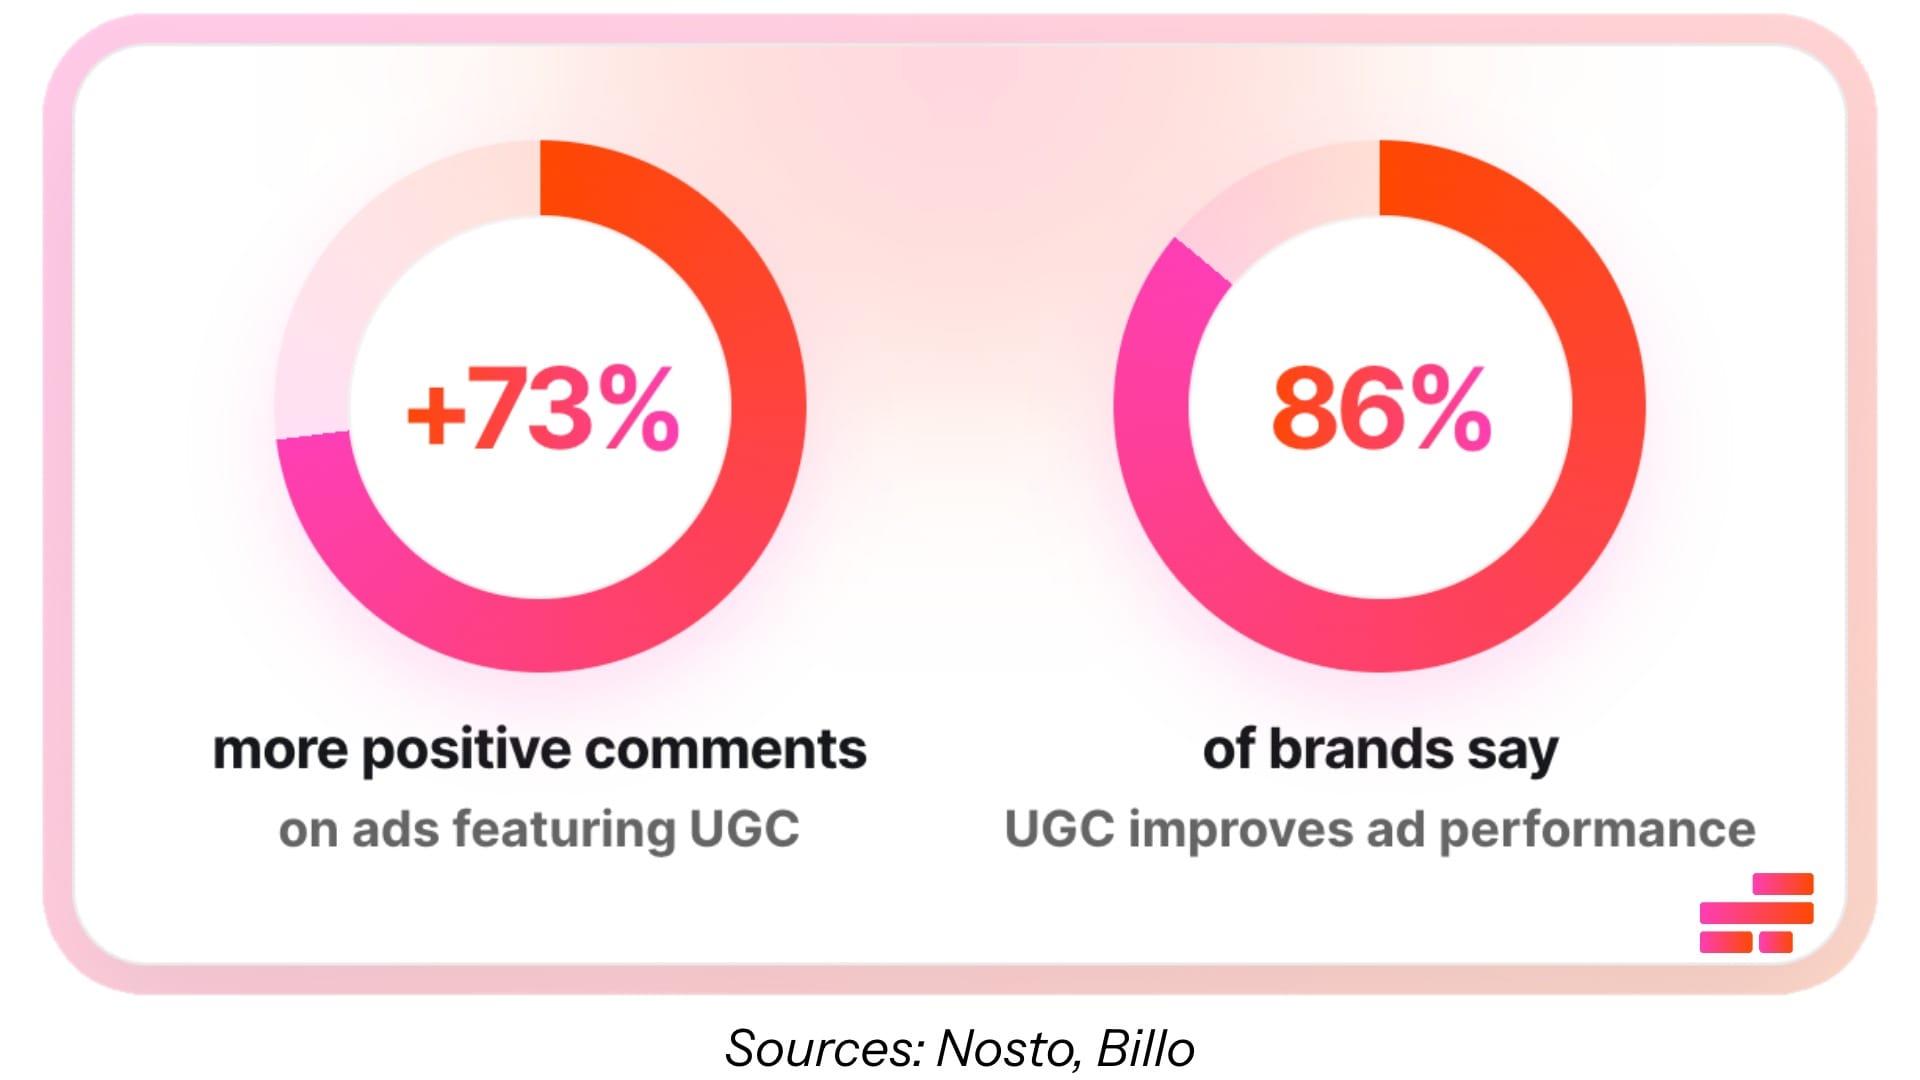
- Ads featuring UGC generate 73% more positive comments
- 86% of brands say UGC improves ad performance
- Consumers find UGC 9.8x more impactful than influencer content
- 72% of consumers want photos/videos from real customers on product pages
- 86% of Gen Z and 81% of Millennials are more likely to buy when UGC visuals are present
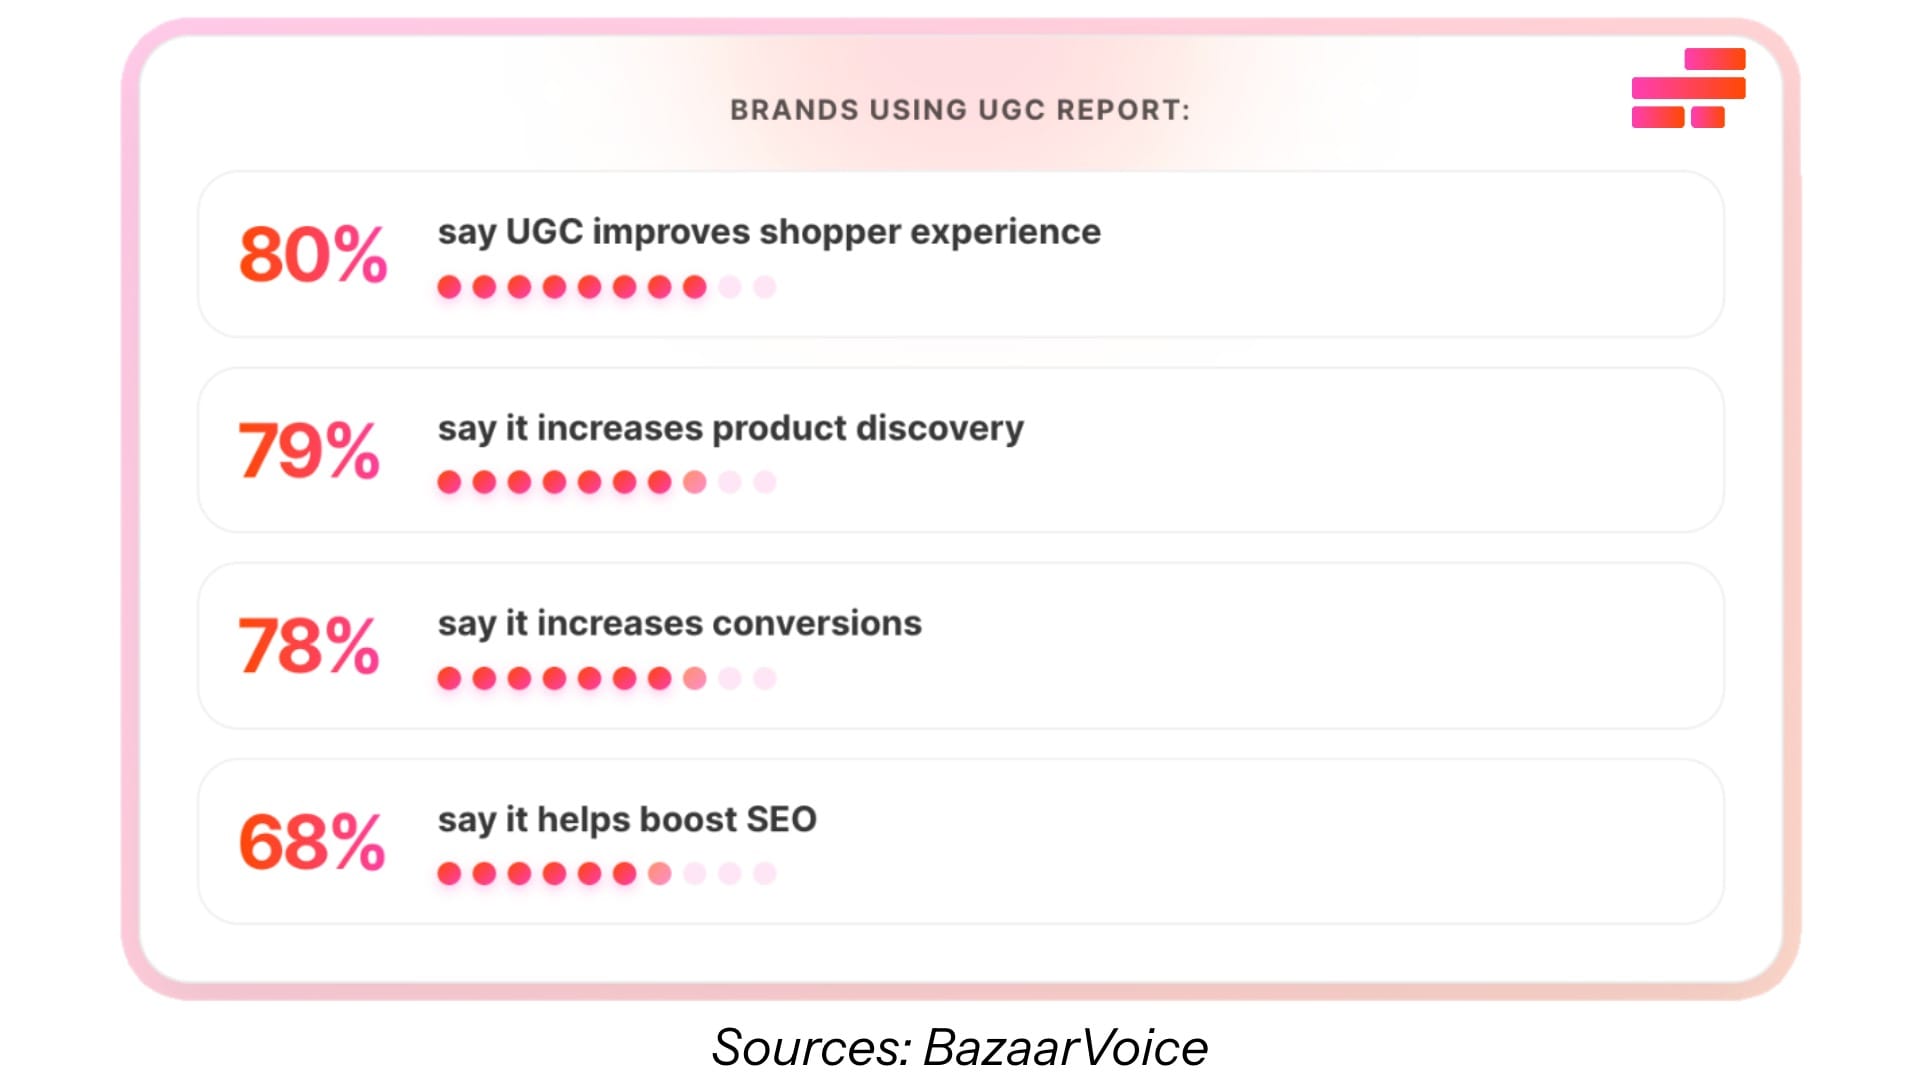
- Among brands using UGC:
- 80% say it improves shopper experience
- 79% increases product discovery
- 78% increases conversions
- 68% helps boost SEO
Sources: Comscore, Stackla, Billo, Nosto, BazaarVoice, PowerReviews
UGC Jobs & Market Statistics
As UGC becomes a bigger part of marketing strategies, it’s also shaping how brands allocate resources and build content pipelines. While “UGC jobs” aren’t always defined in the traditional sense, there’s clear growth in demand for creators, content, and systems to manage it.
This section looks at broader market trends, how much brands are investing in UGC, how fast the space is growing, and where there are still gaps in adoption.
- 67% of retailers plan to increase UGC investment
- The UGC market is growing at ~29% CAGR
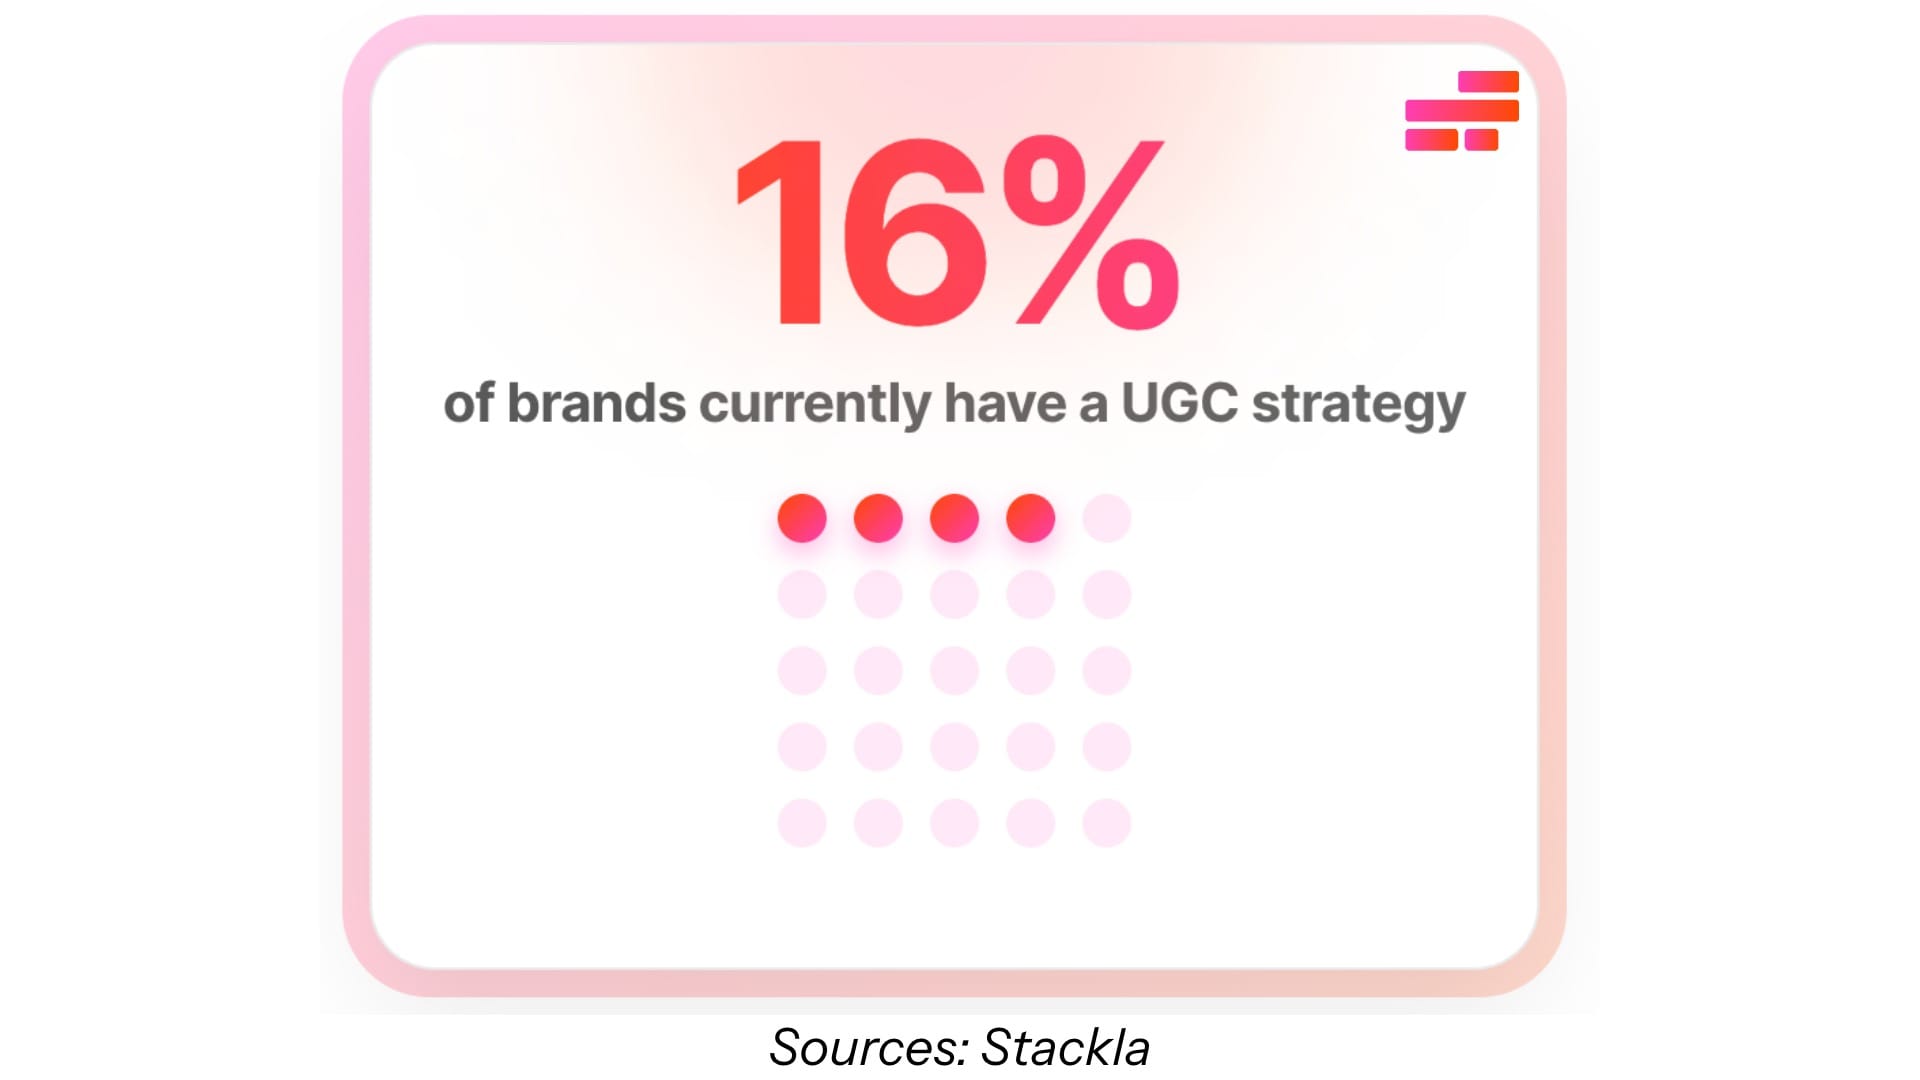
- Only 16% of brands currently have a UGC strategy
- UGC reduces content creation costs by ~30%
Sources: Bazaarvoice, Fortune, Stackla
Social Media & UGC Statistics
Most UGC is created and consumed on social platforms. Whether it’s a TikTok review, an Instagram post, or a YouTube demo, social media is where a lot of product discovery and decision-making happens.
These statistics highlight how users interact with UGC on social platforms, including how it influences discovery, engagement, and purchases.
- 61% of TikTok users have made a purchase after seeing an ad
- 58% of TikTok users discover new brands on the platform
- 60% of internet users trust TikTok creators more than celebrities
Sources: TikTok