
Product Analytics at Startups
A solid product analytics stack is the foundation of data-driven culture. But, in the early days, how and when should founders invest in their startup's product analytics stack? This article explains how to set up a product analytics stack and enforce good data hygiene at a startup.

A solid product analytics stack is the foundation of data-driven culture. Behavioral data enables a development team to track results, connect feature improvements to outcomes, and measure progress to inform decision making. But, in the early days, how and when should founders invest in their startup's product analytics stack?
In this article, I want to share our research about how tech startups measure and track user behavior. Founders who understand other startups’ practices and considerations can lower SaaS expenses, make better decisions about data handling, and avoid costly implementations by getting it right the first time. This article has three sections:
- How our product analytics stack has evolved at Kapwing
- How 6 other startups at various stages track product analytics
- Our advice about making product usage data clean and useful
Kapwing’s Product Analytics
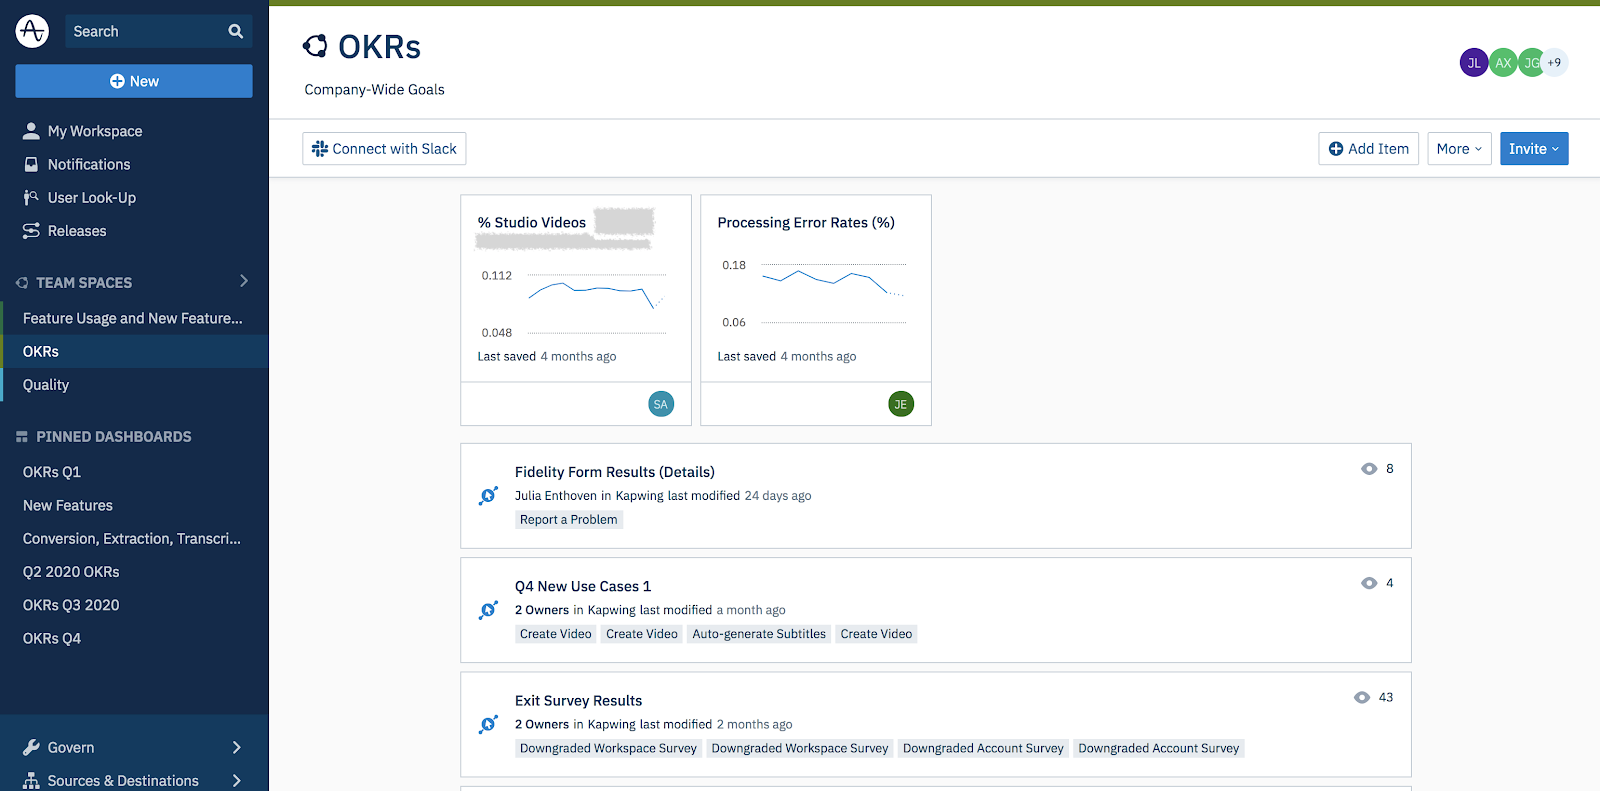
I’m the cofounder and CEO of Kapwing, an online video editor for modern creators. Over the last three years, we’ve gone from a few thousand users to a few million users creating hundreds of thousands of projects a day on the website. As we’ve hired more people, we’ve used OKRs to track progress each quarter and establish a data-driven culture. Here’s a bit about our journey along the way:
Year 0: Bootstrapping
For the first year of Kapwing’s existence, we didn’t track in-product metrics at all. A/B testing was useless before we had a real product and users, so we didn’t waste time with instrumentation. About six months after publishing the first landing page, we set up a basic custom admin panel for top-level KPIs, like the number of videos made per day.
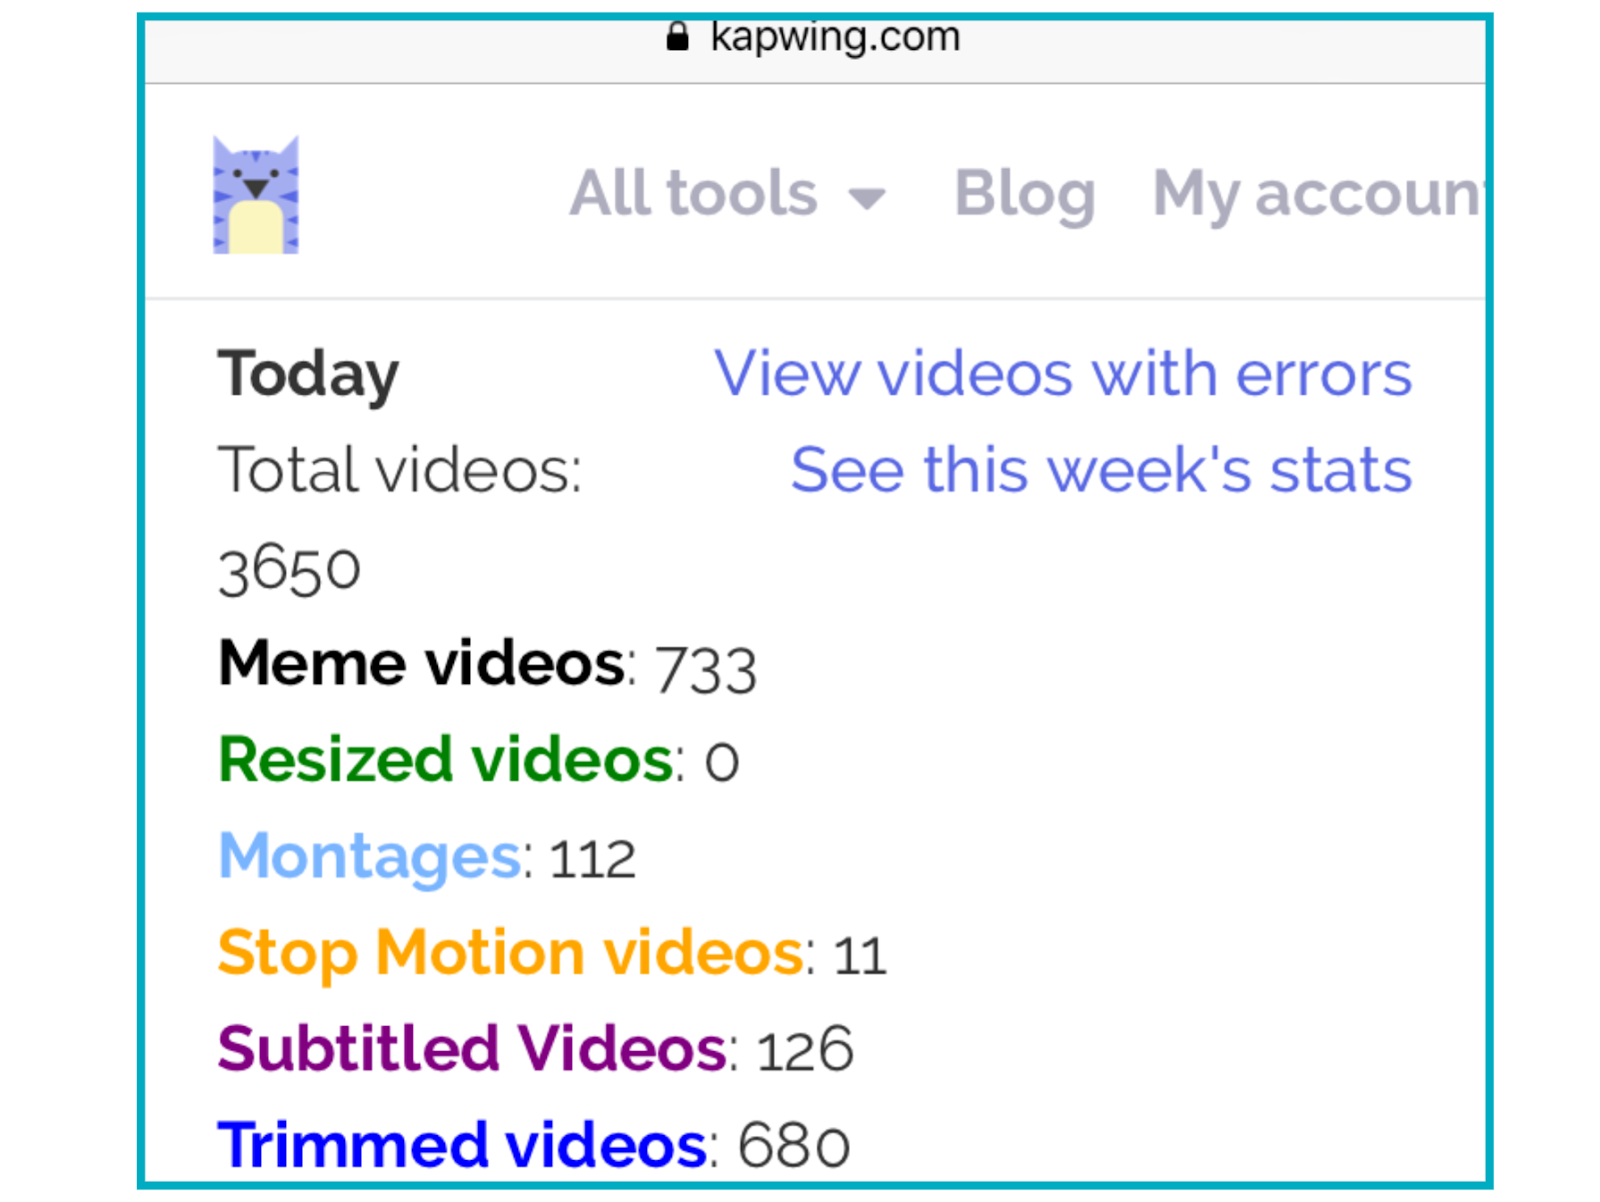
For more nuanced questions, I queried our database directly. This took some time, especially when researching answers for investors during our seed fundraise. In my experience, investors will expect you to know more about usage behavior than you do or should in the early days.
Year 1: Google Analytics
In the second year of our startup (after launching the Studio Editor in the fall), we used a limited set of events in Google Analytics to understand user behavior. We triggered GA events when users subscribed, signed in, uploaded assets, and exported a video.
Google Analytics is entirely free and gives good insight into user acquisition, but it’s clunky and hard to customize and share for basic saved dashboards. Our basic implementation meant we could flag errors and track our acquisition strategies, but couldn’t answer basic product questions like “how often do users make a video with a text layer?” or “what features are popular with customers?”
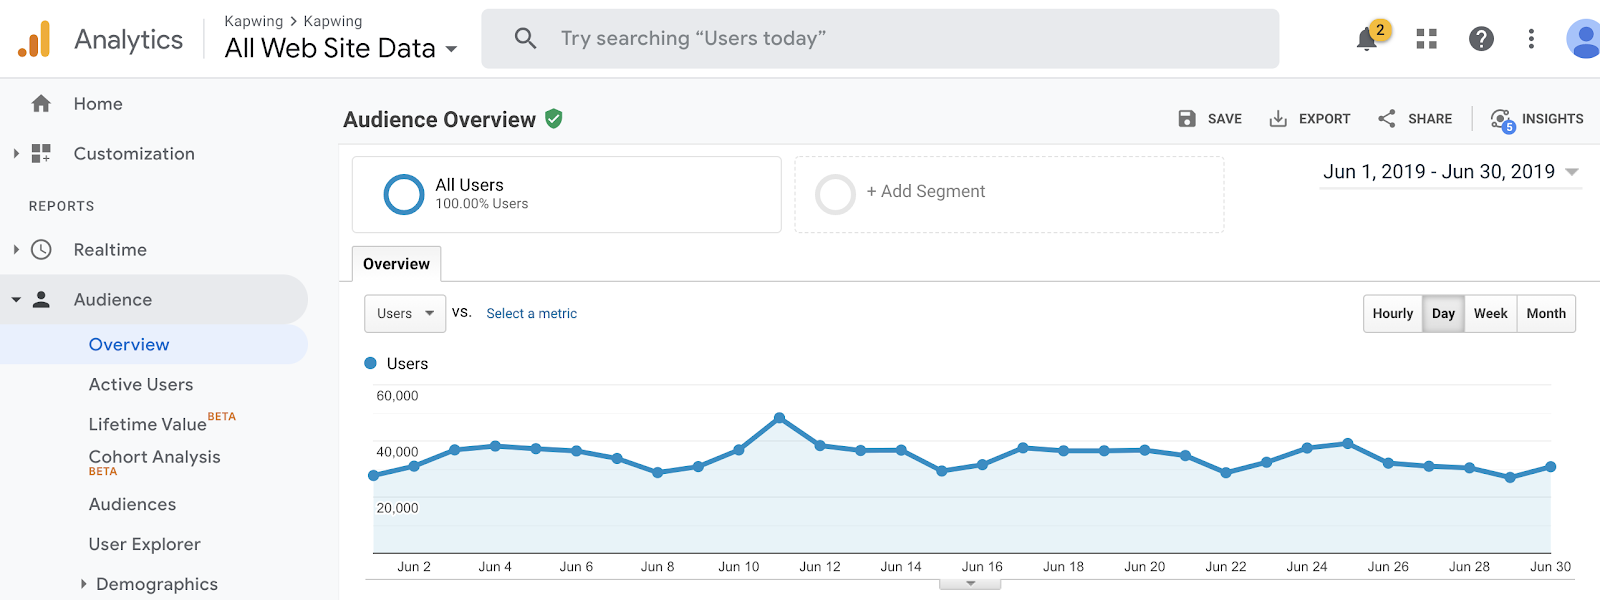
At the time, we had about 1 Million monthly active users making ~20,000 projects everyday, but we had little insight into how they were using our product.
Year 2: Amplitude
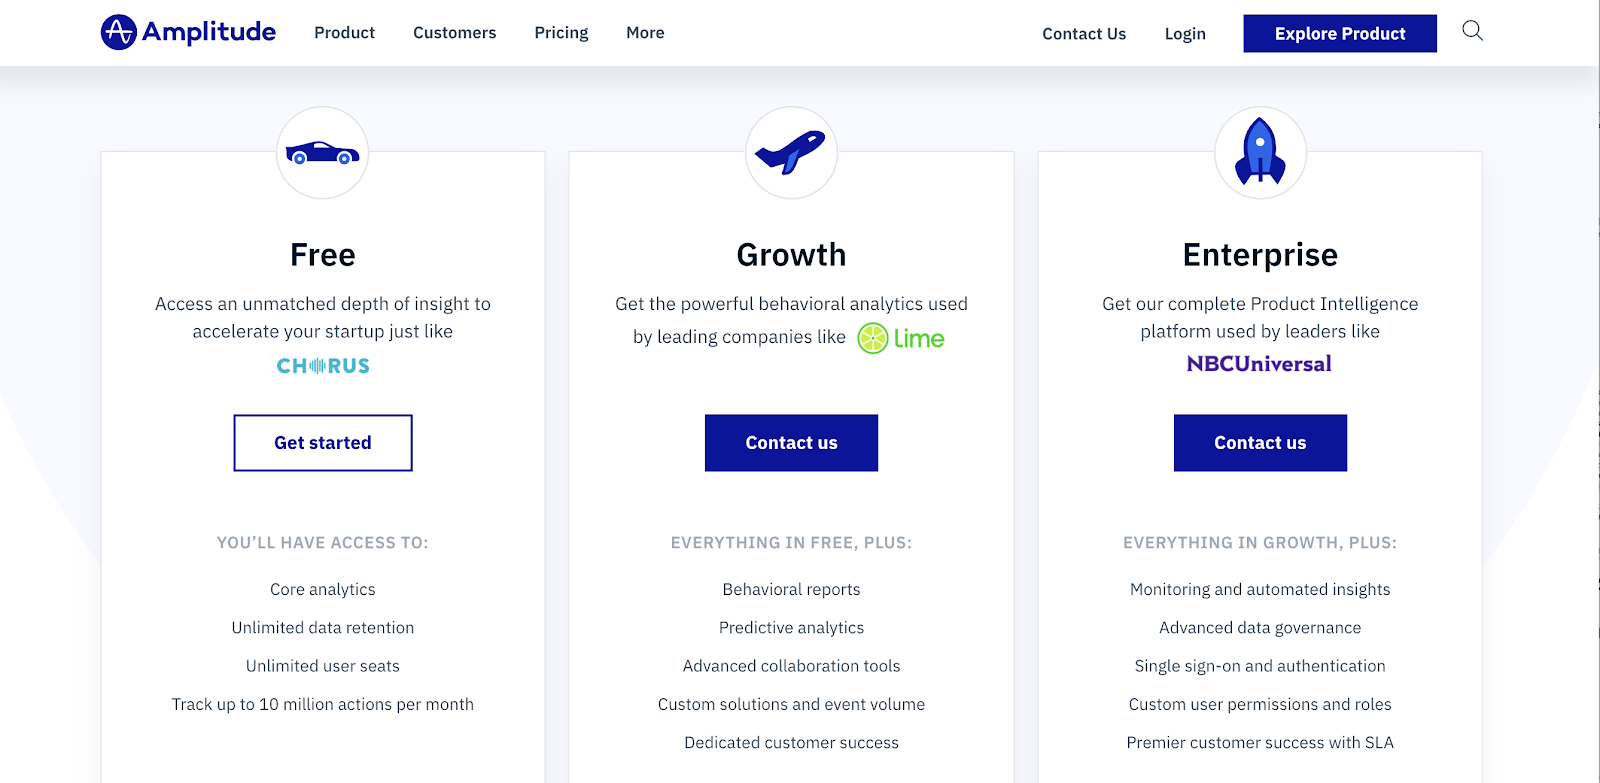
Before starting Kapwing, my cofounder and I worked at Google, where everything is built in house, so we had no idea what tools were out there for product analytics. Thankfully, one of our first engineers - Shah Ahmed - had previously worked at an analytics startup and was familiar with the space. In early 2020, a few months after closing our Series A financing, Shah recommended and set up Amplitude, then trained the development team on how to instrument events and event properties.

Amplitude gives us deeper insight into product usage and user behaviors. Now we can answer questions like “What percent of users sign in?” and “How many videos does the average customer make in a month?” Our dashboards helped us understand our users, track OKRs, land features, and craft fundraising narrative.
As of early 2021, we have about 3 Million monthly active visitors, dozens of thousands of paid subscribers, and hundreds of thousands of videos made daily. We use Amplitude’s free tier to monitor user behavior and Google Analytics plus our in-house admin panel for acquisition and top-level KPIs.
Future
As our volume and query needs grow, we will have to change our product analytics stack, and the cost will likely increase. We will likely upgrade to Amplitude’s Growth tier, which costs about $40,000/year and supports 15M events/month, next month.
Eventually, we expect to lean on a solution like Segment to collect data and send it to several other tools (Amplitude, GA, Freshdesk, etc). Segment adds a lot of value because you don’t have to implement data pipelines between tools and can “playback” data, or retroactively pipe old data into a new tool. But Segment is not cheap, so we’ve avoided adopting it prematurely.
We will likely have to use a data warehousing solution to gather data. A data warehouse is one of the only ways to gather massive amounts of data in a cost effective way. We could funnel data into visualization tools to query data in more powerful ways (pivot tables, charts with axes representing any data, current state dashboards, etc). At some point, we’ll need more complex analyses than Amplitude - and other events-driven analytics tools - supports.
What Do Other Startups Do For Product Analytics?
In August 2020, we had questions about how startups measure usage behavior and gathered research from our founder friends about common “analytics stacks” for startups. The below descriptions are quotes pulled directly from emails with the founders:
Venture-Backed Web SaaS - Seed
I looked about a year ago at this problem as we needed to move off of Mixpanel. We aren't quite as far along as Kapwing, but are now again thinking about this as our Amplitude Scholarship program runs out next month.
We bit the bullet and decided to double down on Segment and Amplitude (expensive x 2!). We route everything we can into Amplitude (usually via Segment). This includes Customer.io for all email events, Typeform for survey responses, Helpscout for help site visits, Nickelled for onboarding guides (we're going to move to Chameleon or AppCues), Logrocket for session replay. It's spendy, but it's awesome to get a complete picture of the user journey across all our touchpoints (turns out to really help with troubleshooting support issues too).
The only thing we don't route via Segment are our embeds (we have a lot of people sharing 360-degree images on their websites and that would bankrupt us); those are tracked via Google Analytics on the client side (we do track the server calls).
At the end of the day, I've become more okay with having to pay for these things by thinking of it as "hiring" the software to do something we'd otherwise need to staff with a person. But these tools — if you pick the right complementary ones — can give you amazing capabilities if you maximize what they're good for and get them to play with each other.
I also haven't found anything better than Amplitude for the kind of product analytics we want; there are tons of other solutions but they tend to be really oriented at marketers.
Venture-Backed Ecommerce - Seed
Amplitude is great because of its versatility and at least it's cheaper than MixPanel.
Honestly at [Previous company] we just switched to Kibana after a while because of all those costs, both time and $$. And we needed a much better tool for real time events than what GA offered.
We had a hyper fast product dev process, that often involved every desktop & mobile platform, and usually complex stacks like live video, computer vision, etc.
I wouldn't recommend it to everyone, because it's more manual work and "closer to the metal". But it provided us a lot of power and flexibility.
Venture-Backed Fitness App -- Series A
We're actually pretty bad at this. The most important stuff we just manually log/store/analyze. We have Google Analytics (and Firebase for mobile) set up, but I agree it's limited in its usefulness. ____ is working on some infrastructure to log all clicks but it's still early days for that project. I haven't really looked at other third-party tools. For us, it really matters to unify iOS, Android, and web, and most external tools are optimized for either mobile or web and not really both.
Social App – Series B
We are using Amplitude to track cohort, retention rate, conversion rate + a housemade Fabric dashboard to track real time online users, total events sent with property...
Amplitude is a no brainer on our side. It's a mandatory investment:
- accessible to onboard your team, investors, contractors
- easy to create dashboard/chart
- easy to create cohort and A/B test
- you will gain a lot of time by using it instead of building it
It's costly, but you can bulk events. For example, we send the five first events of a feature to check the signup conversion rate, and then we send an event every five events.
Airtable
Airtable built their own Amplitude equivalent. All of the events and tracking uses this home-grown system. Main reason is to prevent 3rd parties accessing base data. TL;DR Airtable owns this data in their own data warehouse.
SaaS Website – Public Co
We use Segment for event tracking and Amplitude for self-service frontend event analysis. All events (backend and frontend) are aggregated in our warehouse and we use Mode Analytics for analysis, dashboarding, collaboration, and investigation. (there are some other services we use for data replication, ad hoc analysis, and ETL processes).
Rough annual costs:
- mode - $75K
- amplitude - $125K
- segment - $122K
How to Enforce Good Product Analytics Practices at a Startup
From Shah, Kapwing Product Manager and resident product analytics expert
After setting up product analytics, startups should invest in and enforce data cleanliness practices to ensure that the data is useful. If your startup has good data hygiene, your product analytics will have much more impact as the team will have a much easier time referencing data to inform decisions. You will also save money as many data platforms are free to use up to a quota. In Amplitude, for example, developers can track a maximum of 10 Million monthly active events in the free tier.
Data cleanliness doesn’t happen by default; it requires effort and intention. Left to their own devices, engineers will often implement badly-named events, introduce redundant events, and add data schemas that non-technical teammates don’t understand. They may want to log every key-value pair in an object, for example, in case they want to refer to the analytics later. That’s how you end up with a property in a dropdown called “User.prototype.uuid” that means nothing to everyone. Because I’ve seen startups struggle with terrible data practices in the past, I have been ruthless about new events and properties that engineers implement at Kapwing.
At Kapwing, product managers ensure that properties and events are meaningful and necessary. I review PRs myself, add and remove events, monitor launches, and lead workshops for the engineering team about best practices. As a PM, I treat our data as a product and our team as my favorite customers, fostering a data-driven culture.
Here’s 4 strategies we’ve used to keep our data clean and remove unnecessary event logging:
1) Sampling: Sampling is effective when you only care about the percentage of users that conduct an action vs the absolute number. Kapwing has millions of users, so we can use a massive sampling factor and still have numbers to satisfy the law of large numbers.
2) Timebox experiments: If you need to answer a question, get data from a sample day (or a sample day before and after your change) to see if it answers your question rather than logging data ad infinitum.
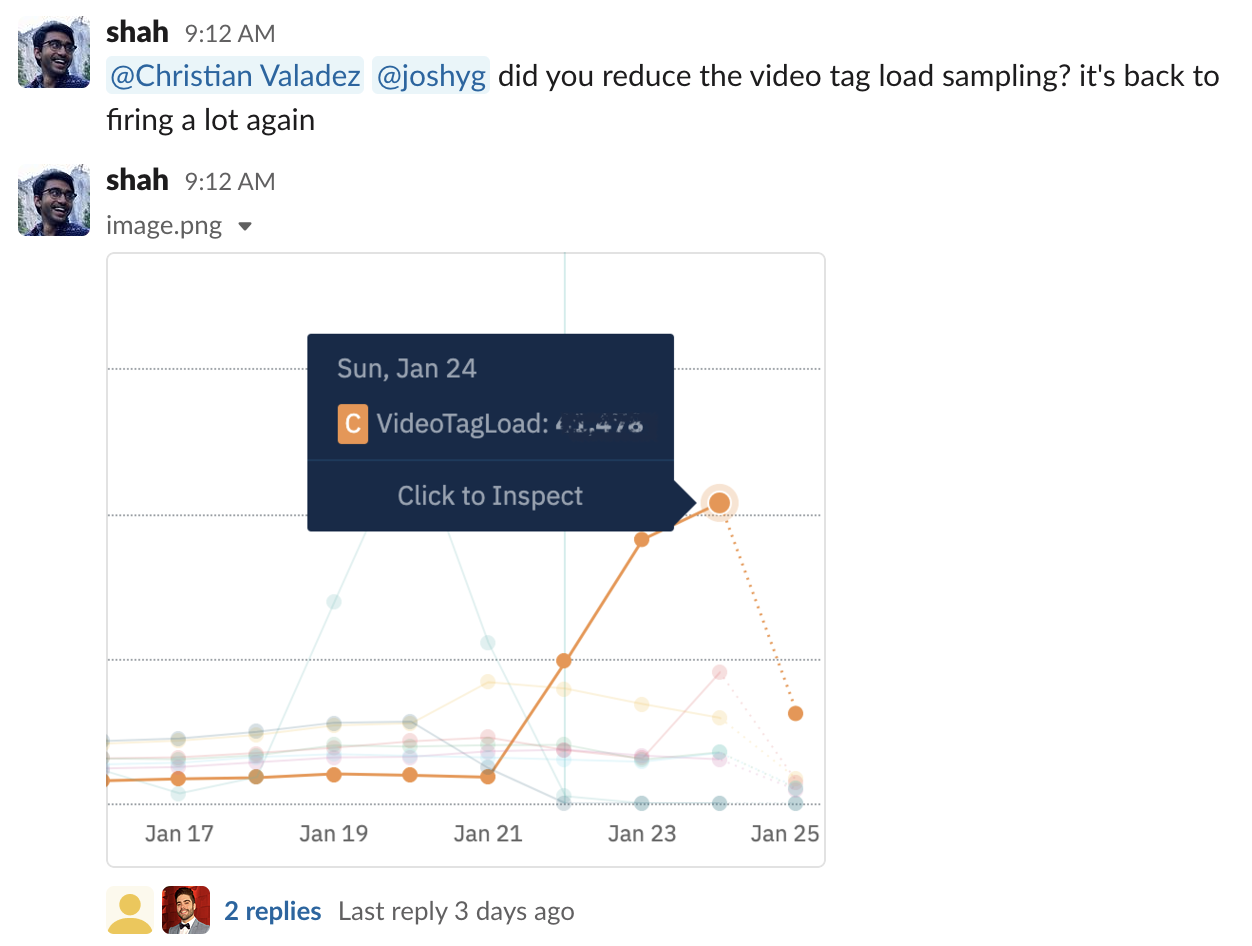
3) Debugging and monitor launches: The fastest way to clutter your dashboard and eat into event quota is to ship an instrumentation bug that fires excessive events. To avoid this, we’ve trained our development team, including our QA testers, to test Amplitude instrumentation. After any launch, we monitor Amplitude event volume to find analytics bugs early.
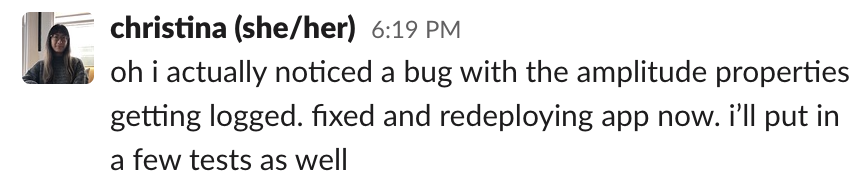
4) Less is more: Only log the data you need to set and validate hypotheses. Avoid the temptation to collect data just because it’s there, and actively remove event logs if they’re not helping you. We proactively deprecate events that are no longer relevant and discuss logging changes in an #analytics Slack channel.
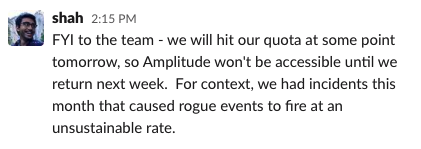
Kapwing’s analytics stack is still a work in progress. On two occasions, we have hit our event quota before the end of the month and “flew blind” for a few days. But we’ve found that Amplitude’s event quotas force us to have discipline around data cleanliness, which is good for the whole company.
Conclusion
Product insights supercharge a product team and strengthen a fundraising narrative, making it easier to achieve product market fit and increase the value of your business. But hasty implementations and over-instrumentation can negate these benefits and make your dashboards unintelligible.
For data that speeds you up instead of slowing you down, be extremely intentional about the data you collect. Start with the questions you need to answer to make crucial decisions and instrument those metrics first. After that, slowly introduce more information that is valuable to the team.
I hope this article gives other entrepreneurs tactical and strategic insights they can use to reduce cost and set up their product analytics stack. Please share with other founders who are trying to understand usage behavior in their own app. Happy hacking and tracking!


