How We Built It: Audiograms in the Browser with Web Audio API & HTML Canvas
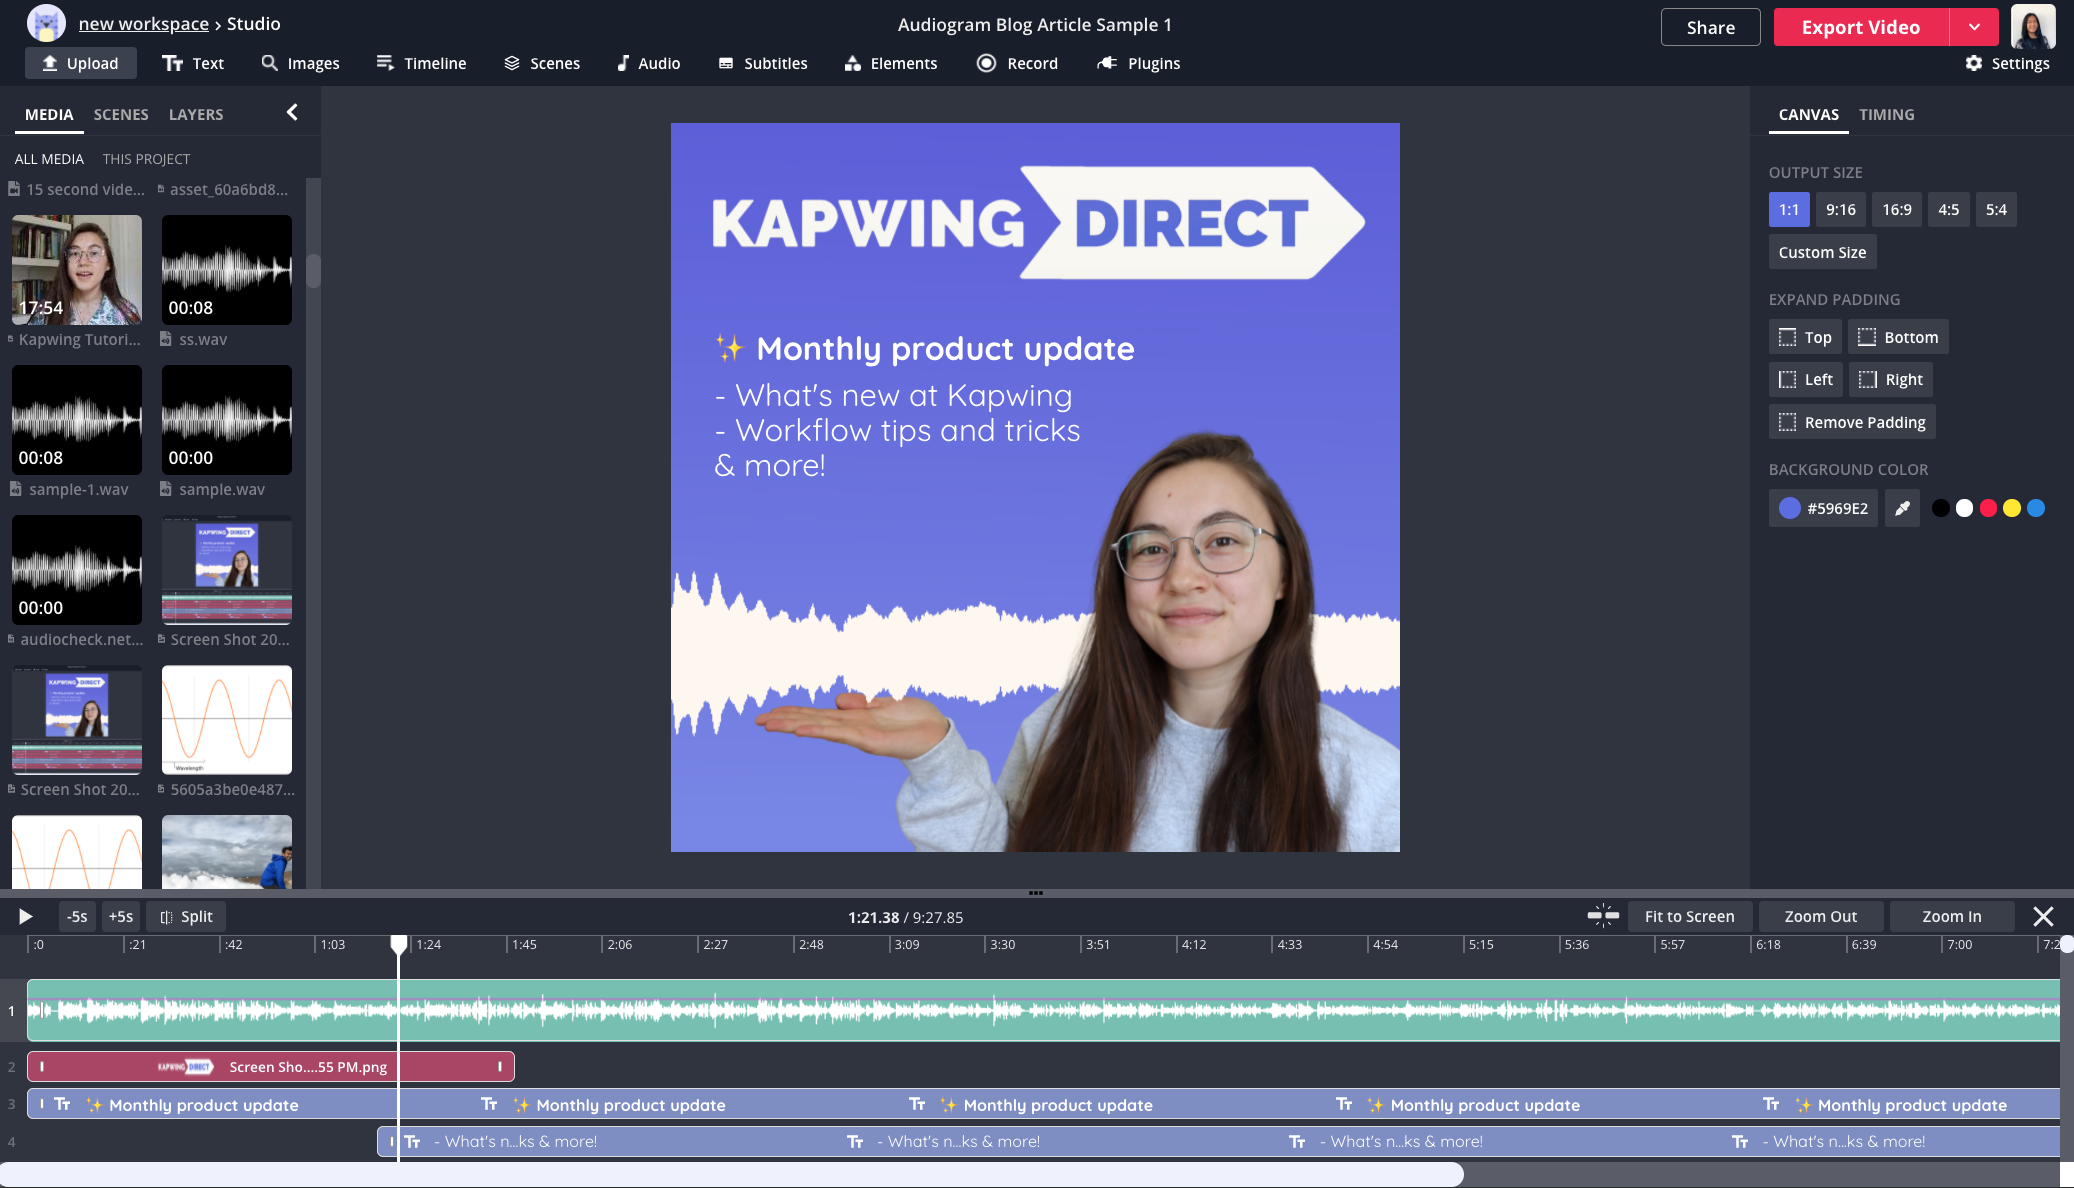
In Kapwing Studio, users can upload an audio or video file of their podcast, favorite song, or interview and make an animated representation of the audio frequency and amplitude over time using our Audio Waveform tool.
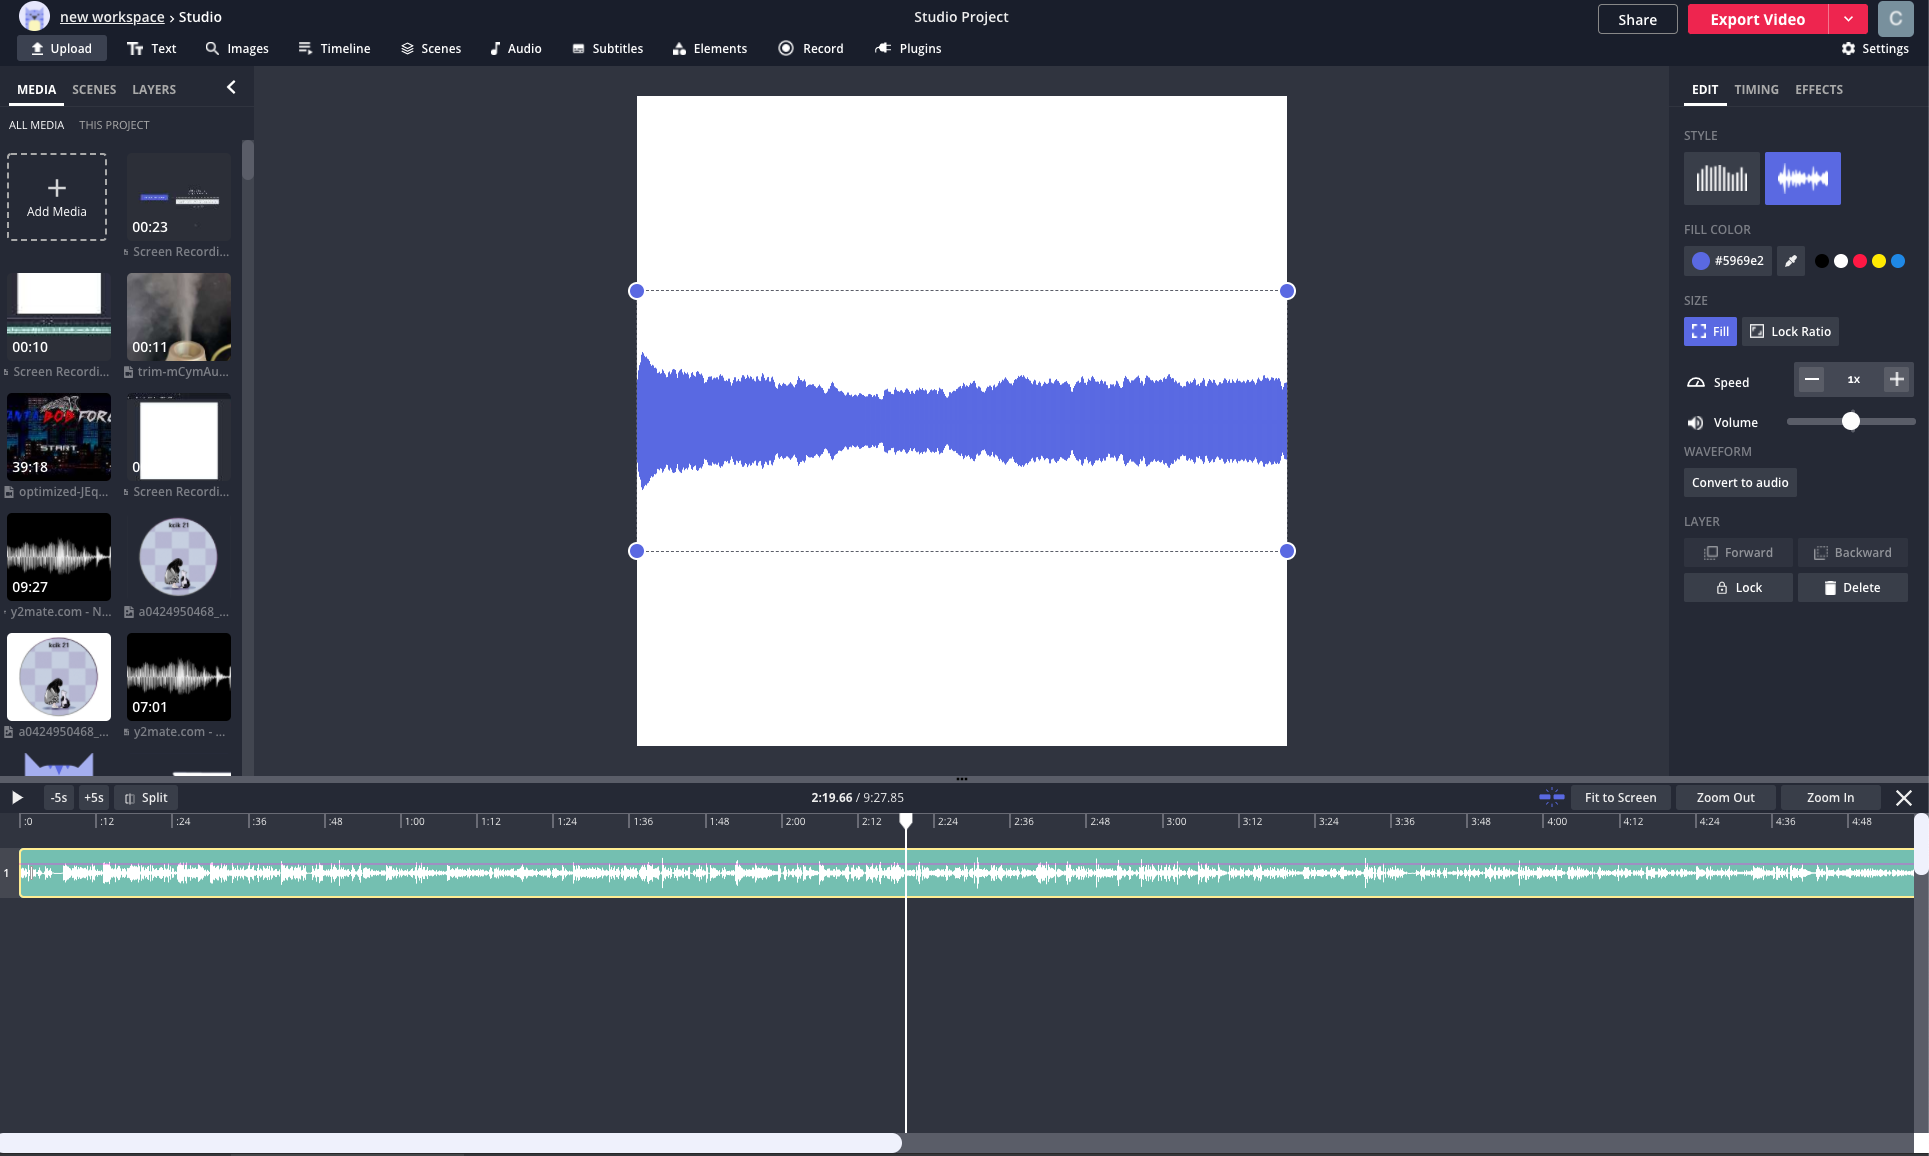
Audio Waveforms in Kapwing
In the past year, many creators have requested that Kapwing provide audio visualization tools. These requests came from YouTubers, game streamers, and especially podcasters. All of these users wanted the same thing: a way to present audio in a dynamic and visually engaging manner. After researching online audio waveform tools, we found that existing products lacked flexibility in audio post-production. It was difficult to trim and add cuts to audio files, or make layout customizations to the final design.
In Kapwing Studio, users can upload an audio or video file of their podcast, favorite song, or interview and make an animated representation of the audio signal over time. Our Audio Waveform tool is conveniently situated alongside a comprehensive suite of other video, image, and text editing features to give users the ability to edit, trim, and embellish their final design for a social-media ready post.
Background of Audio Waveforms
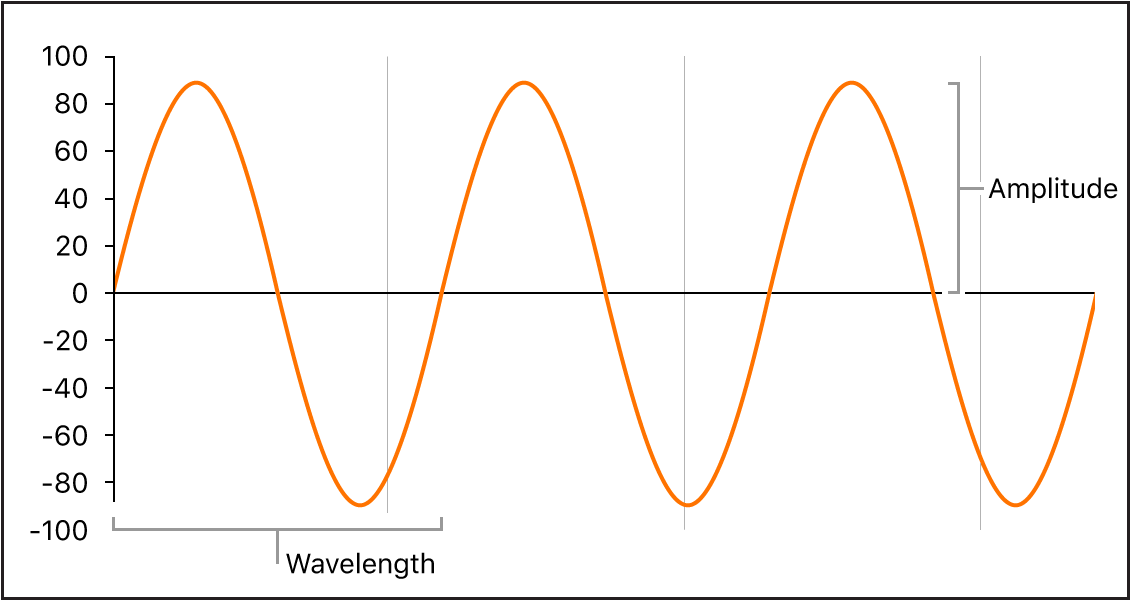
In the world of sound, a waveform is a graph displaying the amplitude of an audio signal over time. The amplitude represents the level of vibrations that are perceptible to the human ear. You may already be familiar with these visual representations when using applications such as Soundcloud.
Before building an audio waveform tool, we asked ourselves: what do we want the waveform to represent? We knew we had certain requirements. In particular:
- The waveform must be deterministic. A single audio source added to our application should create the same waveform every time. Furthermore, we should be able to reproduce this waveform on our backend for export without having to pass large amounts of data to our server.
- The waveform should appear responsive: quiet moments should have low amplitudes, loud moments should have high amplitudes, and changes in pitch should produce visible changes to the waveform.
- While the waveform should be dynamic, the movement should be smooth and not jarring.
Requirement #1 implies that our waveform has to be a deterministic function of the audio signal, but audio waveforms can display information about the audio signal in two ways:
- Time domain: The amplitude of a signal is measured as a function of time. This is a straightforward way to represent sound as one continuous vibration. Many waveform representations, like the ones on Soundcloud, use time domain.
- Frequency domain: This is where things get interesting. A frequency domain plot shows how much of the input signal lies within a range of frequency bands. This is accomplished via Fast Fourier transforms (FFTs), which are ubiquitous in signal processing. With an FFT a sound wave (or any linear time invariant signal) at a given point in time can be represented as the sum of sine waves of varying frequencies. Visual representations of the frequency domain are more similar to equalizers. They display the loudness of different sounds in the frequency range so it is easy to assess the spread of low, mid, and high-range frequencies in a file.
A Quick Note About Audio Frequencies
Depending how familiar you are with audio concepts, you might be wondering what kinds of sounds map to the frequencies we are discussing.
The audio spectrum is the audible frequency range of sound waves the human ear can process. Audio frequencies range from 20 Hz to 20 kHz and are typically put into three buckets: low, mid, and high frequencies.
- Low frequencies: ranging from 20 - 500 Hz, these are lower, more rumbly sounds, like the bass in a song or a car engine starting up.
- Mid frequencies: ranging from 50 Hz - 2 kHZ, this frequency band encapsulates discernible human speech and other more tinny sounds, like a snare drum or trumpet.
- High frequencies: this is a broad range of sounds from 2 kHz - 20 kHz, often described as giving "presence" or "brilliance" to mid range frequency sounds like speech. Bird chips, the whine of a mosquito, and cymbals crashing fall in this frequency range.
You can see how the frequencies shift from low to high in this audiogram we made of an instrument played at ascending octaves:
Video edited on Kapwing
We decided to go with the frequency domain approach to create our waveforms, as they are more visually interesting and illustrate the complexity of sounds.
Building an Audio Waveform in the Browser
To build a responsive audio waveform in the browser, we need:
- An audio source in the DOM
- The audio frequency data
- A way to paint it on the screen
- An animation to show dynamic changes in sound
Audio Source
Kapwing Studio already supports uploads of a multitude of video and audio file types. For simplicity and code reuse, we render files as HTML video elements on the Kapwing Studio Canvas. After a user uploads a file, we have a readily available HTML source of audio in the DOM to start processing.
<video
   ref={this.video}
   src={getAudioSrc()}
   autoPlay
   playsInline
/>
Audio Frequency Data in the Browser With Web Audio API
The Web Audio API is a powerful high-level Javascript API for processing and synthesizing audio on the Web. The foundation of the API is an AudioContext, which is an interface representing an audio-processing graph built from audio modules linked together, each represented by an AudioNode. An AudioContext controls the creation of different nodes and execution of audio processing or decoding.
First, we initialize an AudioContext:
this.audioContext = new AudioContext();
We need to connect our AudioContext to our audio source: the HTML video. We can use createMediaElementSource of the AudioContext interface. This creates a new MediaElementAudioSourceNode object, the audio from which can be played and manipulated. We also create a GainNode to allow adjustments of the audio source volume with a default value of 1 (full volume).
this.source = this.audioContext.createMediaElementSource(this.video);
this.gainNode = this.audioContext.createGain();
this.source.connect(this.gainNode);
this.gainNode.connect(this.audioContext.destination);
this.gainNode.gain.value = 1;
Now our audio source from the HTML video is connected to our AudioContext to receive data about the input signal. To expose audio time and frequency data, we need an AnalyserNode. This interface provides real-time frequency and time-domain analysis information.
this.analyser = this.audioContext.createAnalyser()
How exactly does the Web Audio API analyzer provide real-time frequency domain data? The Web Audio API documentation details the series of steps and formulas it utilizes. Under the hood, it first computes the time domain data, applies a Blackman window, and applies a Fourier transform. Now, with the resulting frequency domain data, it applies a function to smooth the values over time and normalizes them to a decibel range from 0 to 255. The last two steps are critical to how "pretty" the waveform looks when using this data; without smoothing and normalization, there would be sharp, sudden changes between values and jagged peaks.
We have an audio context, an audio source, and an audio analyzer to read frequency data from the audio source. Now it’s time to draw our waveform!
Drawing a Waveform With HTML Canvas
Note that Kapwing is a React app. We use a mix of Hooks and legacy Class Components throughout the application.
After a user uploads an audio file to Kapwing Studio, they can "Convert to waveform." Once enabled, we mount a Waveform component that renders a <canvas> element and creates a canvas context. We pass in width and height attributes from props; every element in Kapwing Studio is freeform resizable, and we want this functionality for waveforms as well.
<canvas width={width} height={height} ref={this.canvas} />;

createWaveform() {
    const canvas = this.canvas.current;
    const ctx = canvas.getContext("2d");
    this.ctx = ctx;

    this.drawZeroStateWaveform();
    this.animateWaveform();
}
For a dynamic and responsive waveform, we must smoothly animate the changes in the input signal. We utilize window.requestAnimationFrame() as a performant method of doing this. Inside the our main animation function, animateWaveform, we add window.requestAnimationFrame() and pass animateWaveform as the callback.
window.requestAnimationFrame(() => {
    ...
    animationFrames += 1;
    this.animateWaveform(false, animationFrames);
    ...
});
Our function is now animating at 60fps (or whatever a user's screen refresh rate is).
The next part is where it all comes together: getting the audio frequency domain data returned from AudioAnalyser and using the data to draw a waveform.
As mentioned earlier, the Web Audio API uses a Fast Fourier Transform (FFT) to represent audio in the frequency domain. We first specify fftSize, which is the the number of samples used in FFT Windowing (the higher the samples, the more granular the data). We then use the analyzer’s frequencyBinCount to get an unsigned integer half that of the fftSize. This generally equates to the number of data values you have to play with for the visualization. Lastly, we call getByteFrequencyData on the frequency array, which converts the frequency into an array of frequency data ranging from 0 to 255. Each array element represents the decibel level for a specific frequency.
 analyser.fftSize = 4096;
 const freqDataArray = new Uint8Array(analyser.frequencyBinCount);
 analyser.getByteFrequencyData(freqDataArray);
Finally, we have a normalized array of frequency data about our audio file. The higher the number, the louder the sound at the frequency band. We can map these values into the height of the waveform to represent sound levels.
There are many ways to depict a waveform. We first chose the simple style of drawing a series of bars at various heights, akin to an equalizer. Each invocation of the animate function iterates over our bar_count (i.e, the total number of bars that fits on our canvas). The number of bars that fits within the canvas width does not always map to the exact number of frequencies in our audio file due to variable window sizes; however, the waveform looks visually appealing and balanced even when some values at the end (e.g., very high frequencies above 10 kHz) are left out. In fact, these very high frequencies are typically low in amplitude and don't add a lot of value to a waveform representation of a typical podcast or song.
ctx.clearRect(0, 0, width, height);
ctx.fillStyle = layer.color;

const bar_count = width;

for (let i = 0; i < bar_count; i += 1) {
    if (layer.waveformStyle === "wave") {
       this.drawWaveStyleWaveform(i, freqDataArray[i], width, height);
    } else if (layer.waveformStyle === "bar") {
       this.drawBarStyleWaveform(i, freqDataArray[i], width, height);
    }
}

drawBarStyleWaveform = (i, frequency, layerWidth, layerHeight) => {
    const barWidth =
      layerWidth * BAR_WIDTH || MIN_BAR_WIDTH;
    const barX = i * (barWidth * SPACING);
    const barY = layerHeight;
    const percentageOfFreq = frequency / NORMALIZED_FREQUENCY_RANGE;
    const barHeight = -(percentageOfFreq * layerHeight) * BAR_HEIGHT;
    ctx.fillRect(barX, barY, barWidth, barHeight);
};
The second style we chose was a fuller waveform that fluctuates in height from a center point, visually closer to a classic time domain waveform. This implementation was a simple matter of mirroring the bar styles along the Y axis, and making the bars denser.
drawWaveStyleWaveform = (i, frequency, layerWidth, layerHeight) => {
    const barWidth =
      Math.floor(layerWidth * BAR_WIDTH) || MIN_BAR_WIDTH;
    const barX = i * barWidth;
    const barY = layerHeight * BAR_Y;

    // make the bar height proportional to the audiogram height
    const percentageOfFreq = frequency / NORMALIZED_FREQUENCY_RANGE;
    const barHeight = percentageOfFreq * layerHeight * BAR_HEIGHT;

    // overlap the top and bottom waveforms
    // slightly to ensure there is no gap
    ctx.fillRect(barX, barY + OFFSET, barWidth, -barHeight); // top
    ctx.fillRect(barX, barY - OFFSET, barWidth, barHeight); // bottom
  };`
Summary
The Kapwing Audio Waveform tool is a convenient way to produce audio content that is visually engaging and highly customizable to your brand and sharing platform. The Web Audio API is a powerful system that makes browser-based audio processing easy. Combined with the powers of HTML Canvas & requestAnimationFrame, it is relatively simple to depict smoothly animated waveforms with JavaScript in a performant manner. From here, the creative possibilities of illustrating audio waveforms are endless.
Create content faster with Kapwing's online video editor →